


Advertisement
I'm an EA coder
Feb 14, 2023からメンバー
9 投稿
Jun 26, 2023 at 04:56
I work for a company which specializes in creating and selling trading robots. I've working for them for 3 years now. I'm looking for some new ideas right now. So for a limited time only, I will code for free for any request given. The source code will be shared here to everyone.
Let's hear it :)
Let's hear it :)

Feb 14, 2023からメンバー
9 投稿
Jun 26, 2023 at 09:23
Only the simplest chart patterns and price actions are possible. Remember this, I'm only a coder. You need to give me the exact details for a particular strategy.
For example:
Can you help me code trendlines? NOPE.
Can you help me code trendlines? The leftmost starting trendline should start from shift 100 bar and end at shift 50 bar. YES.
The more details the better.
For example:
Can you help me code trendlines? NOPE.
Can you help me code trendlines? The leftmost starting trendline should start from shift 100 bar and end at shift 50 bar. YES.
The more details the better.
Feb 14, 2023からメンバー
9 投稿
Jun 26, 2023 at 14:02
Which patterns? Please specify
Jun 28, 2023 at 06:48
Bearish Double Top , Bearish head and shoulders, bearish rising wedge, bearish expanding triangle, bearish triple top
Bullish double bottom, bullish inverted head and shoulders, bullish falling wedge, bullish expanding triangle, bullish triple bottom,
bullish flag, bullish pennant, bullish falling village , descending triangle , symmetrical triangle ,
bearish flag , bearish pennant, bearish rising wedge , descending triangle bearish ,
cup with handle , rounded bottom , rounding top
one day reversal
付属品:
Feb 14, 2023からメンバー
9 投稿
Jun 28, 2023 at 08:37
SO basically the majority of the patterns is what you're saying?
Jun 28, 2023 at 20:17
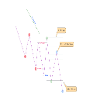
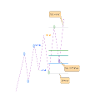
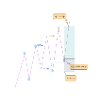
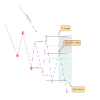
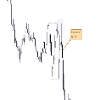
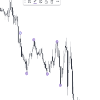
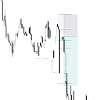
Hi wonderfx, good evening and thanks for the option to code an EA for free. I'll provide a particular visual template for the price pattern i'll like to be coded, because I don't know if I'll be able to explain properly... Basically the pattern is, in a trending market, once there's a brief pause in price in the form of highs and lows, if a low/high is swept, followed by a sweep of the high/low that cleared those low/highs, and then followed by a continuation of price in the first move, At 60% - 70% of the new range that is formed, sell or buy orders can be open (depending on if it is a sell range or buy range) with with stops above the newly created range high/low and targets at the newly created range low/high.
It sounds a bit complex but I promise it isn't .. I will attach a template that clearly illustrates the pattern.
It sounds a bit complex but I promise it isn't .. I will attach a template that clearly illustrates the pattern.
Feb 14, 2023からメンバー
9 投稿
Jun 29, 2023 at 02:35
Let me see if I can code it, based on experience price action patterns are very difficult to code.
Even if I can successfully code it, you will find that it varies from trader to trader, because there's no fixed parameters on how or what is a pattern.
For example:
Scenario 1: crossover strategy moving average - fast period 10 & slow period 50. Everyone can agree 100% on the same thing, there's no confusion here.
Scenario 2: heads and shoulders - sell when break below shoulders level, and vice versa. Then where is the shoulders level. Some will say use closing price, some will say use lowest price. And steepness of the shoulders level. And the width of the shoulders and the head. And two shoulders must be lower than the head. Blah Blah Blah.
Jun 29, 2023 at 10:08
I like what you have so far from my understanding it seems simple enough.
But if you need to it doesnt have to be off pure price action im more into patterns and i trade indices US30 mainly so if you could base it off us30 that would be good
but if not im happy with what you bring
But if you need to it doesnt have to be off pure price action im more into patterns and i trade indices US30 mainly so if you could base it off us30 that would be good
but if not im happy with what you bring
Jun 29, 2023 at 12:06
wonderfxpro posted:
Let me see if I can code it, based on experience price action patterns are very difficult to code.
Even if I can successfully code it, you will find that it varies from trader to trader, because there's no fixed parameters on how or what is a pattern.
For example:
Scenario 1: crossover strategy moving average - fast period 10 & slow period 50. Everyone can agree 100% on the same thing, there's no confusion here.
Scenario 2: heads and shoulders - sell when break below shoulders level, and vice versa. Then where is the shoulders level. Some will say use closing price, some will say use lowest price. And steepness of the shoulders level. And the width of the shoulders and the head. And two shoulders must be lower than the head. Blah Blah Blah.
Please did you see the patterns I sent in? And is that something you can code?


