


Advertisement
LUX (による MarcellusLux )
| 増加 : | +33148.17% |
| ドローダウン | 13.78% |
| ピップス: | 16679.7 |
| 取引 | 558 |
| 勝利: |
|
| 負け: |
|
| タイプ: | リアル |
| レバレッジ: | 1:500 |
| 取引: | 不明 |
LUX 討論

May 19, 2020からメンバー
321 投稿
Sep 20, 2023 at 07:16
What about LUX?
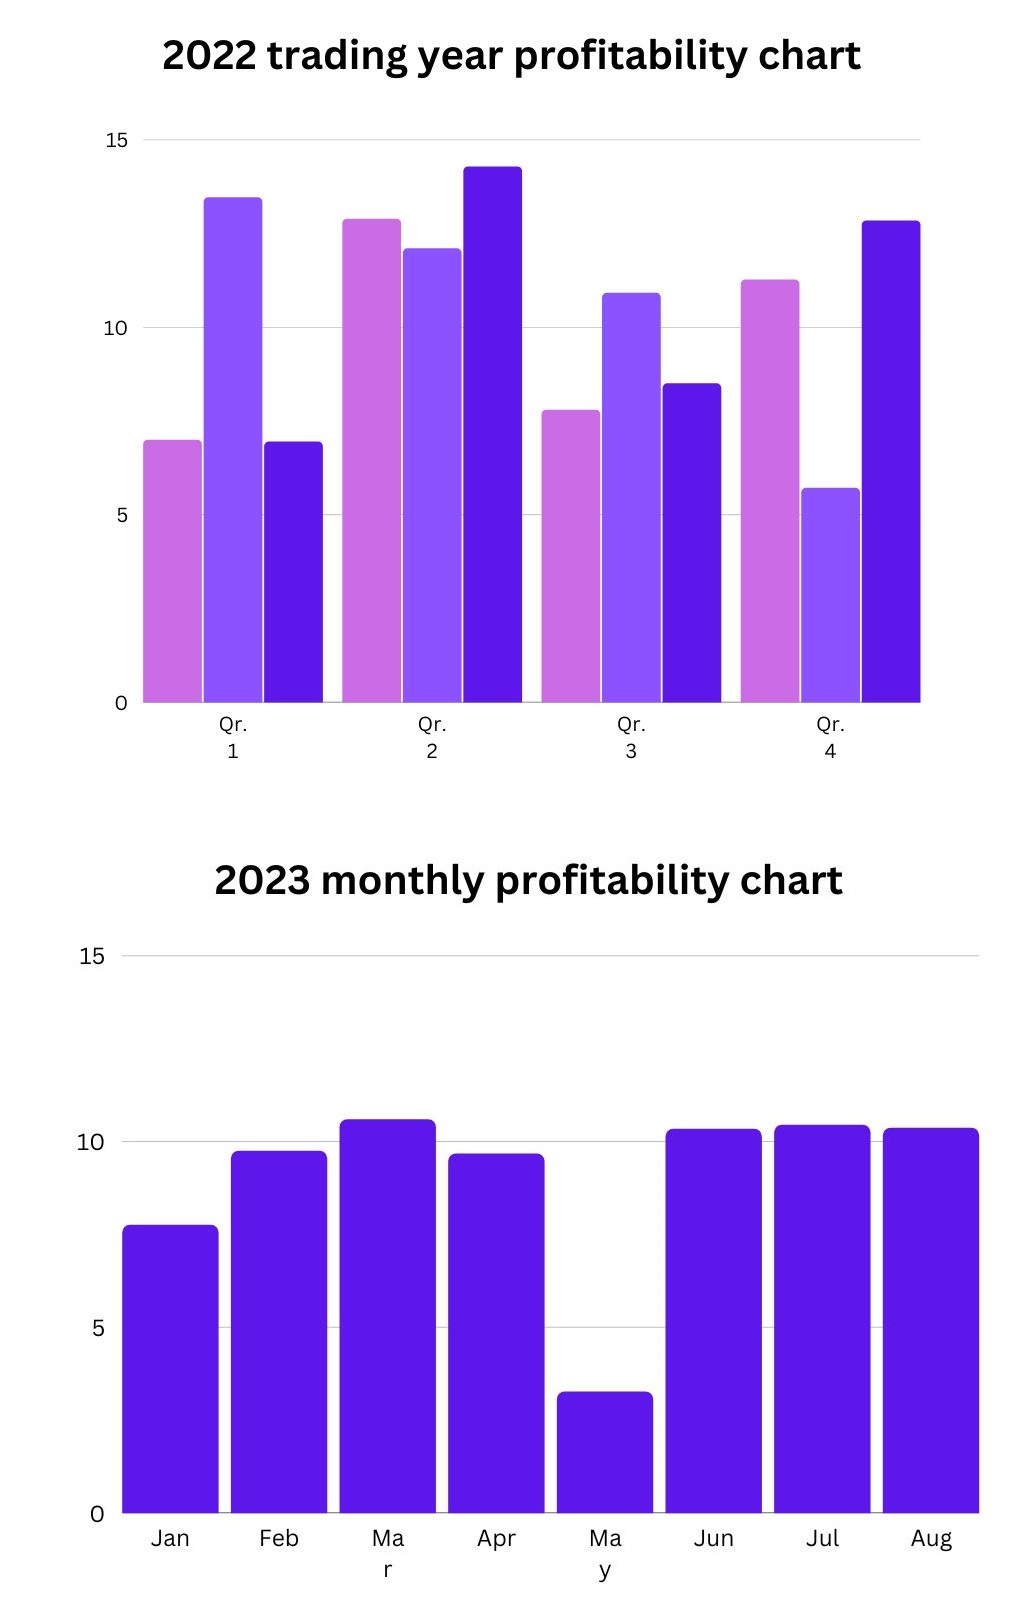
The LUX trading system showed absolutely outstanding profitability results in 2022. But this year I did some work on the mistakes and brought stability to the forefront. The result I got was a stable 10% per month instead of quite strong fluctuations. For example, I have attached graphs of monthly profitability for 2022 and 2023. Compare how much more confident a stable result looks compared to fluctuations.
The LUX trading system showed absolutely outstanding profitability results in 2022. But this year I did some work on the mistakes and brought stability to the forefront. The result I got was a stable 10% per month instead of quite strong fluctuations. For example, I have attached graphs of monthly profitability for 2022 and 2023. Compare how much more confident a stable result looks compared to fluctuations.
付属品:
@Marcellus8610

Oct 17, 2023 at 10:19
Please keep the account discussion page strictly related to the account/system itself, any personal questions or off-topic posts can be messaged to the account owner via the internal messaging system or you can open a topic in the general forum.
Thanks,
Peter,
Myfxbook Support.
Thanks,
Peter,
Myfxbook Support.
Aug 25, 2023からメンバー
8 投稿
Oct 18, 2023 at 20:00
congratz on 17million asset. just a question if the asset size is so big how your broker can handle it when you open a big size lot?
Aug 25, 2023からメンバー
8 投稿
Oct 25, 2023 at 05:30
if it's fake he would show every month 20~30% or 100% profit. there would not be any lose trade. again he would not able to keep this myfxbook account for this longer time.
May 19, 2020からメンバー
321 投稿
Oct 26, 2023 at 17:46
ShahpariGreen posted:
congratz on 17million asset. just a question if the asset size is so big how your broker can handle it when you open a big size lot?
Thanks. I use the platform and services provided by the broker. I have an excellent long-term experience with them and I hope that it will only get stronger in the future. I suppose my volume would not be a problem since I have many colleagues and friends who trade much larger trades. Indeed, I noticed that the processing time has increased a little after the sharp increase in balance and volume over the past couple of months, but within acceptable conditions for my trading system.
@Marcellus8610
May 19, 2020からメンバー
321 投稿
Oct 26, 2023 at 17:48
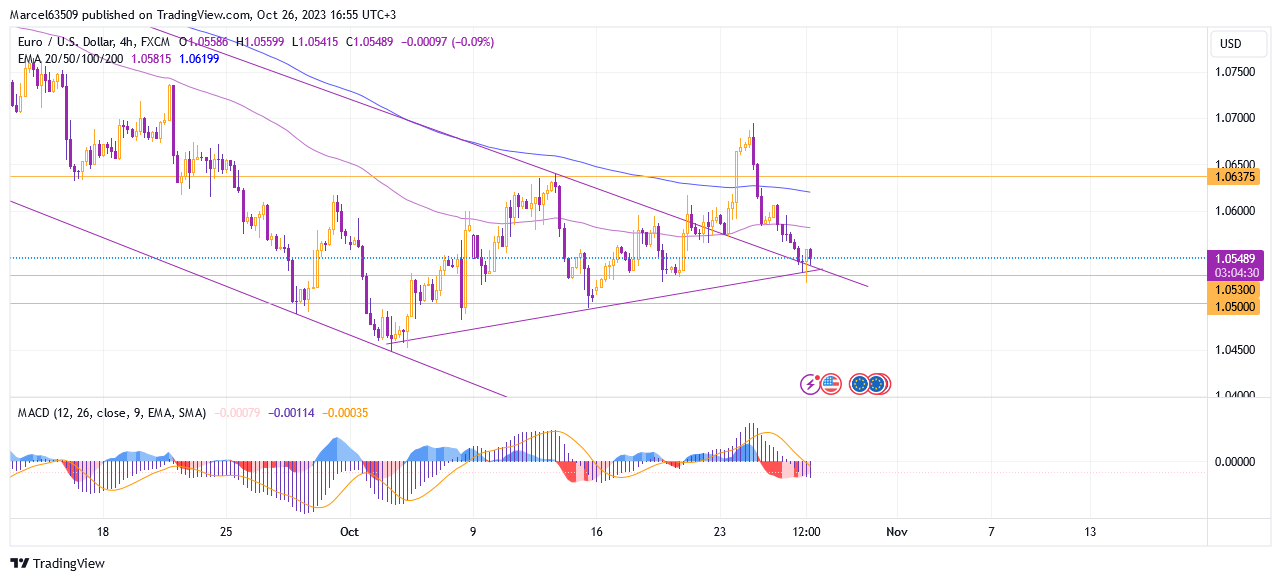
While the downward trend on the daily chart has finally broken through the support of the upward weekly trend, expanding its possible channel, I propose to consider a more local situation.
The four-hour chart clearly shows a correction that has gone beyond the descending channel. The prospect of a return to the longer-term uptrend remains intact. However, if the marker support level of 1.05300 is broken, the probability of returning to the channel will increase and I will expect a fall to 1.05000 and possibly to 1.04500. The intersection of EMA lines on the daily chart is confirmation of a possible fall. It is also worth noting that on the four-hour MACD shows a strong selling trend, while moving into the area of negative values.
In addition to the fact that I am considering the possibility of a decline within the trend, I would like to mention the fact that the daily MACD has a fairly confident growing trend, despite this contradicts the EMA positions. Therefore, I will consider the EMA 100 level 1.05830 on the four-hour chart as a marker for possible growth to the key resistance 1.06375. Moreover, the price level is now close to the correction channel support area and further decline will mean the end of this local correction trend.
.png)
The four-hour chart clearly shows a correction that has gone beyond the descending channel. The prospect of a return to the longer-term uptrend remains intact. However, if the marker support level of 1.05300 is broken, the probability of returning to the channel will increase and I will expect a fall to 1.05000 and possibly to 1.04500. The intersection of EMA lines on the daily chart is confirmation of a possible fall. It is also worth noting that on the four-hour MACD shows a strong selling trend, while moving into the area of negative values.
In addition to the fact that I am considering the possibility of a decline within the trend, I would like to mention the fact that the daily MACD has a fairly confident growing trend, despite this contradicts the EMA positions. Therefore, I will consider the EMA 100 level 1.05830 on the four-hour chart as a marker for possible growth to the key resistance 1.06375. Moreover, the price level is now close to the correction channel support area and further decline will mean the end of this local correction trend.
付属品:
@Marcellus8610

Oct 31, 2023 at 10:01
MarcellusLux posted:
While the downward trend on the daily chart has finally broken through the support of the upward weekly trend, expanding its possible channel, I propose to consider a more local situation.
The four-hour chart clearly shows a correction that has gone beyond the descending channel. The prospect of a return to the longer-term uptrend remains intact. However, if the marker support level of 1.05300 is broken, the probability of returning to the channel will increase and I will expect a fall to 1.05000 and possibly to 1.04500. The intersection of EMA lines on the daily chart is confirmation of a possible fall. It is also worth noting that on the four-hour MACD shows a strong selling trend, while moving into the area of negative values.
In addition to the fact that I am considering the possibility of a decline within the trend, I would like to mention the fact that the daily MACD has a fairly confident growing trend, despite this contradicts the EMA positions. Therefore, I will consider the EMA 100 level 1.05830 on the four-hour chart as a marker for possible growth to the key resistance 1.06375. Moreover, the price level is now close to the correction channel support area and further decline will mean the end of this local correction trend.
https://www.myfxbook.com/files/MarcellusLux/Eur_Usd_Oct_26_%28HDu8eg%29.png
Thanks for the detailed analysis. I'm a bit more bullish on this pair. The recent breakout from the descending channel on the 4-hour chart has made me optimistic about a possible return to the longer-term uptrend. I'll be watching the 1.07000 level closely.
May 19, 2020からメンバー
321 投稿
Nov 02, 2023 at 12:00
Raven1209 posted:MarcellusLux posted:
While the downward trend on the daily chart has finally broken through the support of the upward weekly trend, expanding its possible channel, I propose to consider a more local situation.
The four-hour chart clearly shows a correction that has gone beyond the descending channel. The prospect of a return to the longer-term uptrend remains intact. However, if the marker support level of 1.05300 is broken, the probability of returning to the channel will increase and I will expect a fall to 1.05000 and possibly to 1.04500. The intersection of EMA lines on the daily chart is confirmation of a possible fall. It is also worth noting that on the four-hour MACD shows a strong selling trend, while moving into the area of negative values.
In addition to the fact that I am considering the possibility of a decline within the trend, I would like to mention the fact that the daily MACD has a fairly confident growing trend, despite this contradicts the EMA positions. Therefore, I will consider the EMA 100 level 1.05830 on the four-hour chart as a marker for possible growth to the key resistance 1.06375. Moreover, the price level is now close to the correction channel support area and further decline will mean the end of this local correction trend.
https://www.myfxbook.com/files/MarcellusLux/Eur_Usd_Oct_26_%28HDu8eg%29.png
Thanks for the detailed analysis. I'm a bit more bullish on this pair. The recent breakout from the descending channel on the 4-hour chart has made me optimistic about a possible return to the longer-term uptrend. I'll be watching the 1.07000 level closely.
So, you was almost right about 1.70000 and I hope converted your thoughts into a real profit.
@Marcellus8610
May 19, 2020からメンバー
321 投稿
Nov 02, 2023 at 12:01
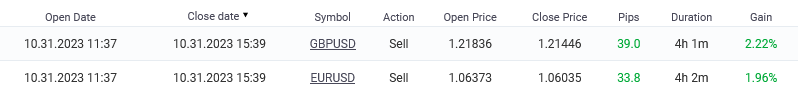
My analysis for the EUR/USD came true in the short term and the market really began to rise after passing through the EMA 100 on the four-hour chart at 1.05830. Having reached the level of 1.06375, a false breakout was attempted, which was a rather interesting moment that I closely monitored. And as you can see, two recent trades are profitable, maintaining the trend of stable profits for the 5th month in a row, after a fairly quiet May.
I will publish the next analytics later.
_for.png)
I will publish the next analytics later.
付属品:
@Marcellus8610
May 19, 2020からメンバー
321 投稿
Nov 06, 2023 at 11:58
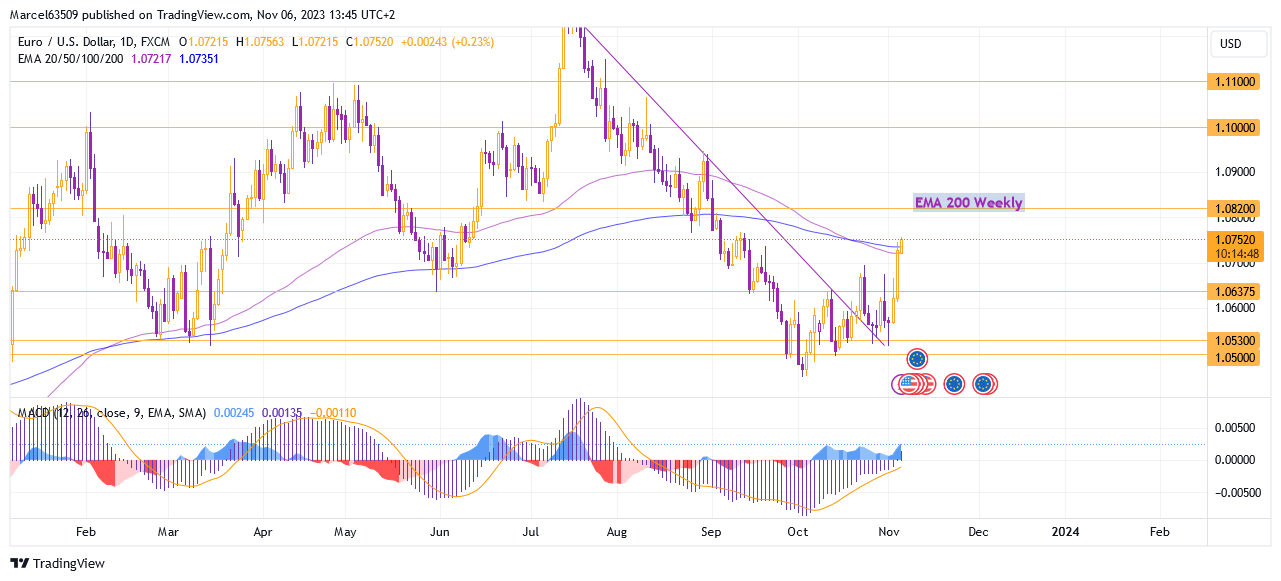
The EUR/USD pair continues to grow. The resistance level of 1.07000 was very confidently broken with continued growth to 1.07500. The current resistance can be visualized as the EMA 100 and EMA 200 lines on the daily chart. Despite the fact that they have already been passed, for now I would not rule out a possible false breakout. This is evidenced by the weak MACD divergence on the hourly chart and the continued intersection of EMA 100 and EMA 200 in the direction of further decline. That is, I can conclude that in the short term a decline is possible under the influence of resistance levels and also some overbought market conditions after a sharp increase and destruction of the downward trend. But in a four-hour and daily perspective, I see a high probability of reaching the resistance level at the 200 weekly EMA, which is now in the resistance area of 1.08200. This level will later become a marker level for further growth to 1.10000 and 1.11000. If the short-term correction is too deep and creates conditions for selling, then the level of 1.06375 will likely be reached again and will be a marker for a further fall to 1.05300.
.png)
付属品:
@Marcellus8610
May 19, 2020からメンバー
321 投稿
Nov 06, 2023 at 12:00
I suppose today the market will start active moves as part of a short-term correction and further growth, so I will closely monitor market processes and if the trading conditions and the indicators of the algorithms are appropriate, then I will consider the opportunity to trade on the movements described.
@Marcellus8610

May 19, 2020からメンバー
321 投稿
Nov 16, 2023 at 10:08
EthanGun posted:
Saw your trading today and had a question. Will your system work on small volumes??
The trading system can be scalable and, of course, with certain settings, can work with any volume of trades and balance. But setting up the system takes time and is not a simple process. The algorithms that I use to calculate risks and probabilities are very precise in setting and highly dependent on market conditions and account parameters.
@Marcellus8610


