


gold advise

Biedrs kopš
1117 ieraksti
Nov 15, 2018 at 16:35
There is a pullback indeed, but the precious metal is still consolidating sideways between $1,200 and $1,215 and so far there is no signal that consolidation will end.

Biedrs kopš
775 ieraksti
Nov 16, 2018 at 02:15
Gold has found a good resistance at the 55 day EMA around the 1216 level and if the price bounces to the downside, it may consolidate between the 1200 level and the 55 day EMA. The most relevant support levels are the 1180 level and the low at the 1160 level. Above the 55 day EMA, the 200 day EMA is still its most relevant resistance at the 1245 level.
Biedrs kopš
1117 ieraksti
Nov 16, 2018 at 18:22
Gold broke out above $1,215 and continued rising towards $1,222, next week the move to the upside will probably continue.
Biedrs kopš
1117 ieraksti
Nov 19, 2018 at 17:29
Gold is still consolidating around $1,222 but the move to the upside towards $1,230 will probably continue.
Biedrs kopš
775 ieraksti
Nov 20, 2018 at 00:18
Gold breaks above the 55 day EMA at the 1216 level and reaches the 1223 zone. To the upside, we must be aware of the 200 day EMA around the 1244 level, because it could act as resistance. Below the 55 day EMA, its next support is still the 1200 level.
Biedrs kopš
1117 ieraksti
Nov 20, 2018 at 17:56
(labots Nov 20, 2018 at 17:58)
The sideways consolidation continues and Gold has formed a shooting star candlestick at $1,230 on the four-hour time-frame, there may be a new move to the downside.
Biedrs kopš
1117 ieraksti
Nov 21, 2018 at 18:32
Gold continues testing $1,230 but so far there is no breakout above that level. A breakout above it could lead to another move to the upside towards $1,245.
Biedrs kopš
1117 ieraksti
Nov 22, 2018 at 17:57
Gold is consolidating sideways, next target will likely be around $1,220.
Biedrs kopš
1117 ieraksti
Nov 23, 2018 at 18:23
There is still no breakout below $1,220, there likely won't be one until the end of the day.
Biedrs kopš
1117 ieraksti
Nov 26, 2018 at 18:15
Gold is still consolidating and it has formed a spinning top candlestick at $1,228 on the daily time-frame, so the move to the downside will probably continue.
Biedrs kopš
775 ieraksti
Nov 27, 2018 at 01:03
Yes, indeed. The consolidation on gold continues around the 1223 level, with the 55 day EMA around the 1218 level acting as support. To the upside, the 200 day EMA at the 1243 level could act as resistance.
Biedrs kopš
10 ieraksti
Nov 27, 2018 at 11:04
I am looking for gold to range between 1240 and 1180 for the next 3-6 months. Global economics should be stable but not strong which will lead to flat gold demand
Biedrs kopš
1117 ieraksti
Nov 27, 2018 at 18:13
Gold is consolidating sideways indeed, next target is likely at $1,200. A breakout below that support could lead to a further move to the downside towards $1,180.
Biedrs kopš
775 ieraksti
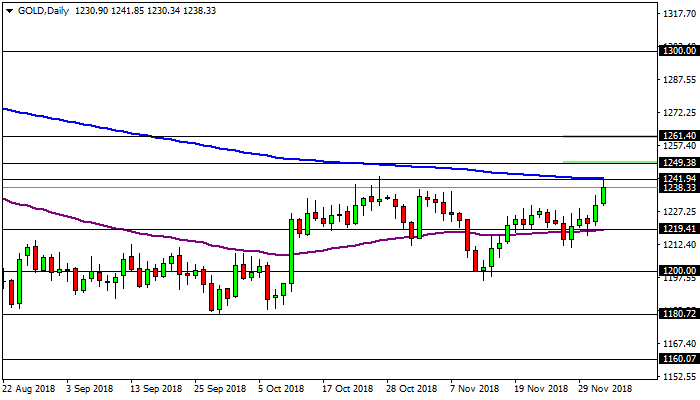
Dec 04, 2018 at 20:43
Possible obstacles on gold’s rally. Gold accelerates its bullish momentum during today’s session and reaches the 1241 level, zone that is has not visited since October 26th. Gold has been supported by the pullback on the Dollar, but if the greenback goes back to its bullish trend, then gold may try to fall back down. Even if the price of gold manages to break above the 200 day EMA at the 1241 level, its next resistances are at the 1249 level where we can find the 55 week EMA and the 1261 level where we can find the 200 week EMA. In case of a breakout above the 200 week EMA at the 1261 level, gold could have the road clear for a rally to the 1300 level. On the other hand, if gold pulls back down, then the 55 day EMA at the 1219 level could act as support, followed by the 1200 psychological level.
Pielikumi
Biedrs kopš
775 ieraksti
Dec 07, 2018 at 21:09
Good rally on gold above the 200 day EMA at the 1241 level to reach the 55 week EMA at the 1249 level. Above the 55 week EMA, its next resistance could be the 200 week EMA at the 1261 level. To the downside, the 1220 level could act as support.
Biedrs kopš
775 ieraksti
Dec 15, 2018 at 21:32
Gold drops again below the 200 day EMA at the 1242 level, but its is leaving a long lower shadow on the daily candle, which could be a sign that buyers are taking control of the market.
Biedrs kopš
775 ieraksti
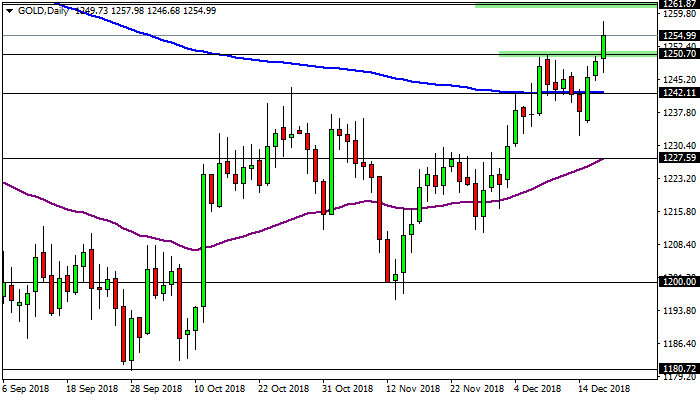
Dec 19, 2018 at 18:01
Bullish breakout on gold. The price of gold breaks above the 55 week EMA at the 1250 level and settles around the 1254 level. Gold is supported by the drop on the US Dollar and if it continues higher, the 200 week EMA at the 1261 level could act as resistance. In case of a pullback, the 200 day EMA at the 1242 level could act as support. Below the 200 day EMA, its next support could be the 55 day EMA at the 1227 level.
Pielikumi
Biedrs kopš
775 ieraksti
Dec 20, 2018 at 20:05
Gold breaks above the 1261 level where we can find the 200 week EMA, but it could find some resistance around that zone. In case of a pullback, the 55 week EMA at the 1250 level could act as support, followed by the 200 day EMA at the 1242 level.
Biedrs kopš
10 ieraksti
Dec 21, 2018 at 11:33
Is gold anti correlated to stocks? Gold has increased as S&P has fallen. Is this what they call a flight to safety?


