


BTCUSD Analysis: Bitcoin fluctuated downward

Fundamental Analysis of BTCUSDBTCUSD Key Takeaways
- Powell hawkish words: Yesterday, Federal Reserve Chairman Powell believed at the hearing that the neutral interest rate has risen, and will try to stop the balance sheet reduction according to market conditions, and reiterated that there is no need to rush to adjust interest rates.
- US data: Today, the United States will announce the unadjusted CPI annual rate in January, and the market expectation and previous value are both 2.90%. If inflation shows a shrinking trend like the job market, the Federal Reserve will be in a dilemma.
Technical Analysis of BTCUSD Daily and Hourly ChartsBTCUSD Daily Chart Insights
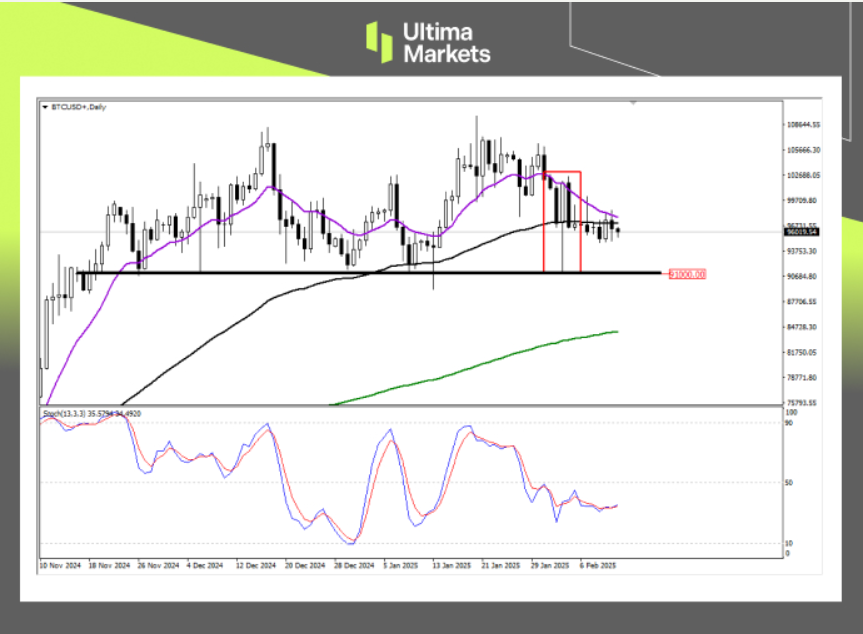
(BTCUSD Daily Price Chart, Source: Ultima Markets MT4)
- Stochastic oscillator: The indicator is oscillating and entangled below the 50 median line, suggesting that the short-term long and short forces are unclear.
- PA: After the market price closed the pin bar on February 3, it showed that the 91000 area was a strong support price. However, due to the subsequent engulfing pattern on February 4, it was clear that Bitcoin was still mainly in a downward trend in the short term. After the market price fell below 65ma, the next target was still to look at the 91000 support level.
BTCUSD 1-hour Chart Analysis
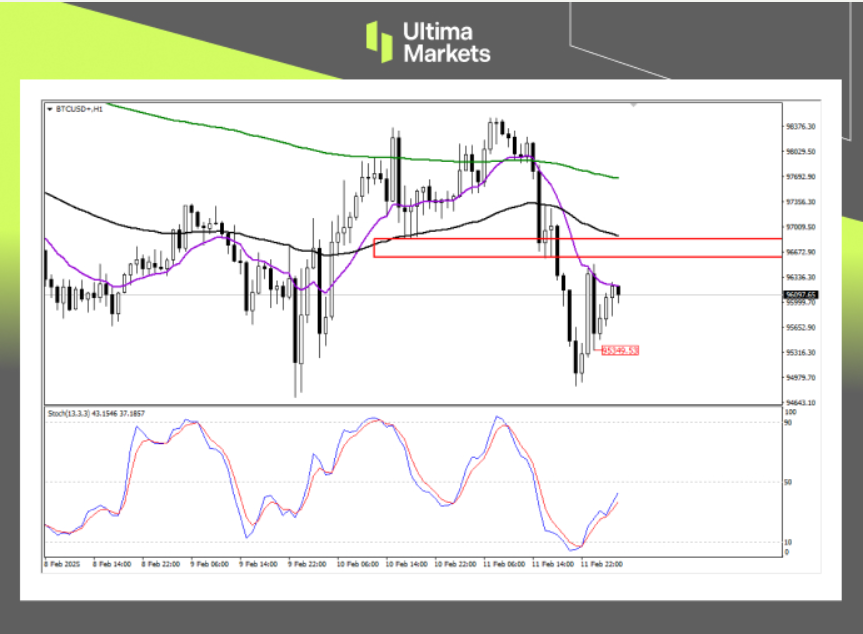
(BTCUSD H1 Price Chart, Source: Ultima Markets MT4)
- Stochastic oscillator: The indicator once again sent a long signal during the Asian session. Based on the strong decline yesterday, the rise during today’s Asian session is temporarily regarded as a rebound structure.
- Resistance area: Bitcoin has rebounded to the purple 13-period MA. If it continues to break upward, it will look to the black 65-period MA, which is also the market structure shift (MSS) area. At that time, investors can pay attention to whether there are short-selling opportunities.
Pivot Indicator Insights for BTCUSD
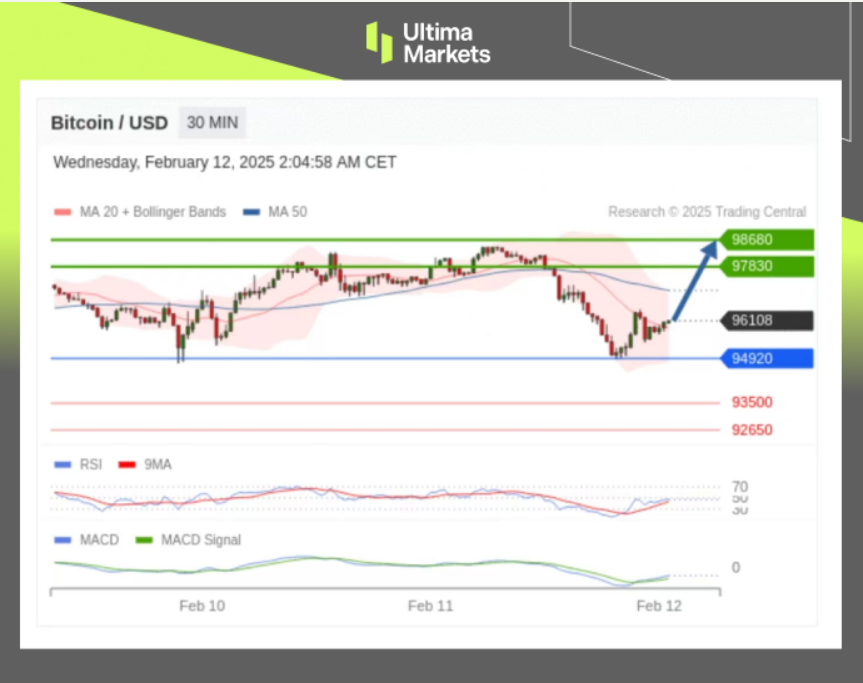
(BTCUSD M30 Price Chart, Source: Ultima Markets APP)
- According to Pivot Indicator in Ultima Markets APP, the central price of the day is established at 94920,
- Bullish Scenario: Bullish sentiment prevails above 94920, first target 97830, second target 98680;
- Bearish Outlook: In a bearish scenario below 94920, first target 93500, second target 92650.
How to Navigate the Forex Market with Ultima Markets To navigate the complex world of trading successfully, it’s imperative to stay informed and make data-driven decisions. Ultima Markets remains dedicated to providing you with valuable insights to empower your financial journey.
For personalized guidance tailored to your specific financial situation, please do not hesitate to contact Ultima Markets.
Join Ultima Markets today and access a comprehensive trading ecosystem equipped with the tools and knowledge needed to thrive in the financial markets.
Stay tuned for more updates and analyses from our team of experts at Ultima Markets.
—–
Legal Documents
Ultima Markets, a trading name of Ultima Markets Ltd, is authorized and regulated by the Financial Services Commission “FSC” of Mauritius as an Investment Dealer (Full-Service Dealer, excluding Underwriting) (license No. GB 23201593). The registered office address: 2nd Floor, The Catalyst, 40 Silicon Avenue, Ebene Cybercity, 72201, Mauritius.
Copyright © 2025 Ultima Markets Ltd. All rights reserved.
Disclaimer
Comments, news, research, analysis, price, and all information contained in the article only serve as general information for readers and do not suggest any advice. Ultima Markets has taken reasonable measures to provide up-to-date information, but cannot guarantee accuracy, and may modify without notice. Ultima Markets will not be responsible for any loss incurred due to the application of the information provided.


Copper Signals a Potential Turning Point for Commodity Markets

Weekly Recap and Forecast: Gold and Silver Rebound on Weak NFP Numbers. Crude Brent falls to $70 a barrel

The dollar: has the trend been broken?

Soft jobs report pressures dollar, gold surges, stocks mixed

Yen Volatility Heightened by Intervention Risk and Soft US Jobs

NFP Below Forecasts, Fed Bets Repriced - CPT Markets

EBC Markets Briefing | Crude prices up as inventory extended decline


