


Advertisement
Bitcoin (BTC) analysis thread

Участник с Apr 09, 2019
516 комментариев
Apr 27, 2022 at 09:42
Still no confidence in the bullish sentiment at the moment. No impetus at all in price action
If you can't spot the liquidity then you are the liquidity.

Участник с Feb 07, 2015
24 комментариев
Apr 27, 2022 at 18:32
sebking1986 posted:
Still no confidence in the bullish sentiment at the moment. No impetus at all in price action
I feel like more and more financial institutions are waking up to the reality of BTC and the potential problems it can alleviate.
I think more and more notable people are getting involved too.
Maybe I'm watching too much Saylor talk about it - but I'm pretty optimistic.
Sam.peters@

Участник с Oct 20, 2018
283 комментариев
Apr 27, 2022 at 20:25
Hi all.
I`m here again but this time will be a bit more different from the other ones.
I`ll be short and most of you will not like the below chart may be, but in the markets we must be always emotionless.
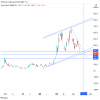
In short, BTC price could be at the edge of the cliff right now. When we look at the daily chart we’re seeing a very good looking ascending channel. That’s bullish right, but when we zoom out we’re seeing something a lot more different than bullish. That’s a bear flag. If you don’t know what a bear flag is then just google it, but a bear flag, like it`s name is showing, is a bear pattern. There’s no confirmation breakdown yet but if this happen we could see a price drop to the mid $20K - around $25000. We just got to be prepared and the world (and BTC) would NOT end with this. Will this happen only the time will show. When will be the bottom if this happen… Think I have something in my pocket to point the bottom but I`ll tell you more about this if and when this drop happen.
That’s it for now. A simple and clear chart. I hope that such negative charts will be less and less in future but that`s the real life. I have something positive prepared for the next time too plus some trading strategies testing but for all of this… when the time have come.
See ya.
I`m here again but this time will be a bit more different from the other ones.
I`ll be short and most of you will not like the below chart may be, but in the markets we must be always emotionless.
In short, BTC price could be at the edge of the cliff right now. When we look at the daily chart we’re seeing a very good looking ascending channel. That’s bullish right, but when we zoom out we’re seeing something a lot more different than bullish. That’s a bear flag. If you don’t know what a bear flag is then just google it, but a bear flag, like it`s name is showing, is a bear pattern. There’s no confirmation breakdown yet but if this happen we could see a price drop to the mid $20K - around $25000. We just got to be prepared and the world (and BTC) would NOT end with this. Will this happen only the time will show. When will be the bottom if this happen… Think I have something in my pocket to point the bottom but I`ll tell you more about this if and when this drop happen.
That’s it for now. A simple and clear chart. I hope that such negative charts will be less and less in future but that`s the real life. I have something positive prepared for the next time too plus some trading strategies testing but for all of this… when the time have come.
See ya.
Приложения:
momchil_slavov@
Участник с Dec 09, 2013
138 комментариев
Apr 28, 2022 at 16:01
The level of 38K seems to be a level of support. However, the daily chart does not show that it may gather bullish momentum soon. We may have to wait for a weekly candle to come out as a bullish reversal to go long in Bitcoin.
Участник с Jul 20, 2020
385 комментариев
Apr 30, 2022 at 15:09
It is in such a tight range. It is hard to see where it is going without a breakout to assist. Ill be holding to make sure i am happy with the direction after the retest
Участник с Oct 20, 2018
283 комментариев
May 04, 2022 at 10:42
CraigMcG2020 posted:
It is in such a tight range.
Absolutely. It's so boring already.
momchil_slavov@
Участник с Dec 09, 2013
138 комментариев
May 05, 2022 at 17:50
Bitcoin had a strong bearish day today. It seems that the candle may close below the support. If that happens, the price may remain bearish in the daily chart for a while. There is a down trending trendline. The buyers may have to wait for the price to make a breakout at that resistance to go long in Bitcoin.
Участник с Apr 09, 2019
516 комментариев
May 11, 2022 at 11:26
I think we will see these lows and support broken this time around and head to the low 20k region.
If you can't spot the liquidity then you are the liquidity.
Участник с Dec 09, 2013
138 комментариев
May 13, 2022 at 06:44
Bitcoin has been extremely bearish. The daily chart shows that the price made a bearish breakout at 30K. Thus, the sellers may drive the price towards the South as long as the price stays below 30K. I assume that Bitcoin may remain bearish for some weeks.
Участник с Jul 20, 2020
385 комментариев
May 14, 2022 at 14:46
sharabela posted:
Bitcoin has been extremely bearish. The daily chart shows that the price made a bearish breakout at 30K. Thus, the sellers may drive the price towards the South as long as the price stays below 30K. I assume that Bitcoin may remain bearish for some weeks.
Im looking at sub 15k there is a strong institutional marker there

Участник с Jul 20, 2019
338 комментариев
May 14, 2022 at 16:58
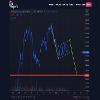
I don't expect anything before August... 😄
Приложения:
patience is the key
Участник с Jul 20, 2019
338 комментариев
May 14, 2022 at 17:04
momo3HC posted:
Hi all.
I`m here again but this time will be a bit more different from the other ones.
I`ll be short and most of you will not like the below chart may be, but in the markets we must be always emotionless.
In short, BTC price could be at the edge of the cliff right now. When we look at the daily chart we’re seeing a very good looking ascending channel. That’s bullish right, but when we zoom out we’re seeing something a lot more different than bullish. That’s a bear flag. If you don’t know what a bear flag is then just google it, but a bear flag, like it`s name is showing, is a bear pattern. There’s no confirmation breakdown yet but if this happen we could see a price drop to the mid $20K - around $25000. We just got to be prepared and the world (and BTC) would NOT end with this. Will this happen only the time will show. When will be the bottom if this happen… Think I have something in my pocket to point the bottom but I`ll tell you more about this if and when this drop happen.
That’s it for now. A simple and clear chart. I hope that such negative charts will be less and less in future but that`s the real life. I have something positive prepared for the next time too plus some trading strategies testing but for all of this… when the time have come.
See ya.
Oh, wow. Your chart was really well-done with that 25,6k level. 😳
patience is the key
Участник с Apr 16, 2017
37 комментариев
May 15, 2022 at 17:08
I don’t think the bulls will take control for some time however this is a perfect time for bag holders to fill their boots
Участник с Apr 09, 2019
516 комментариев
May 18, 2022 at 12:26
Currently looks like a retrace before another leg lower. I think 20k and then possibly around 12k
If you can't spot the liquidity then you are the liquidity.
Участник с Dec 09, 2013
138 комментариев
May 19, 2022 at 09:16
Bitcoin seems to have found its support in the daily chart. Since it has been bearish for a long time, so the buyers may wait for the price to have another bounce and produce a Double Bottom. A Double Bottom in the daily chart may make the price go towards the upside.
Участник с Apr 09, 2019
516 комментариев
May 19, 2022 at 12:10
I think a double bottom is simply a price target for the bigger players
If you can't spot the liquidity then you are the liquidity.
Участник с Jul 20, 2020
385 комментариев
May 22, 2022 at 14:31
sebking1986 posted:
I think a double bottom is simply a price target for the bigger players
Me too, it is an area where so many institutions know there will be stops placed and liquidity sitting. Its a perfect target in the short and mid term
Участник с Apr 09, 2019
516 комментариев
May 26, 2022 at 09:18
We have consolidation around this level so at some point we will know where the next expansion is heading.
If you can't spot the liquidity then you are the liquidity.
Участник с Jul 20, 2020
385 комментариев
May 28, 2022 at 10:16
sebking1986 posted:
We have consolidation around this level so at some point we will know where the next expansion is heading.
This is where patience is so key. Let the market show us the pathway rather than forcing it


