Edit Your Comment
EUR/USD
Участник с Feb 11, 2018
83 комментариев
Apr 18, 2018 at 07:07
Участник с Feb 11, 2018
83 комментариев
Участник с Apr 08, 2014
1140 комментариев
Apr 18, 2018 at 08:53
Участник с Apr 08, 2014
1140 комментариев
On yesterday session, the EURUSD went back and forward without any clear direction but closed in the middle of the daily range, in addition closed within Mondays’ range, which suggests being clearly neutral, neither side is showing control.
The currency pair is trading above the 10, the 50 and 200-day moving averages that should provide dynamic support.
The key levels to watch: a daily resistance at 1.2510, a daily resistance at 1.2432, a key level at 1.2367 (resistance), the 10-day moving average at 1.2341 (support), the 50-day moving average at 1.2322 (support), a daily support at 1.2287, a swing low at 1.2200 (support), and a key level at 1.2165 (support).
"I trade to make money not to be right."
Участник с Feb 11, 2018
83 комментариев
Apr 19, 2018 at 07:36
Участник с Feb 11, 2018
83 комментариев
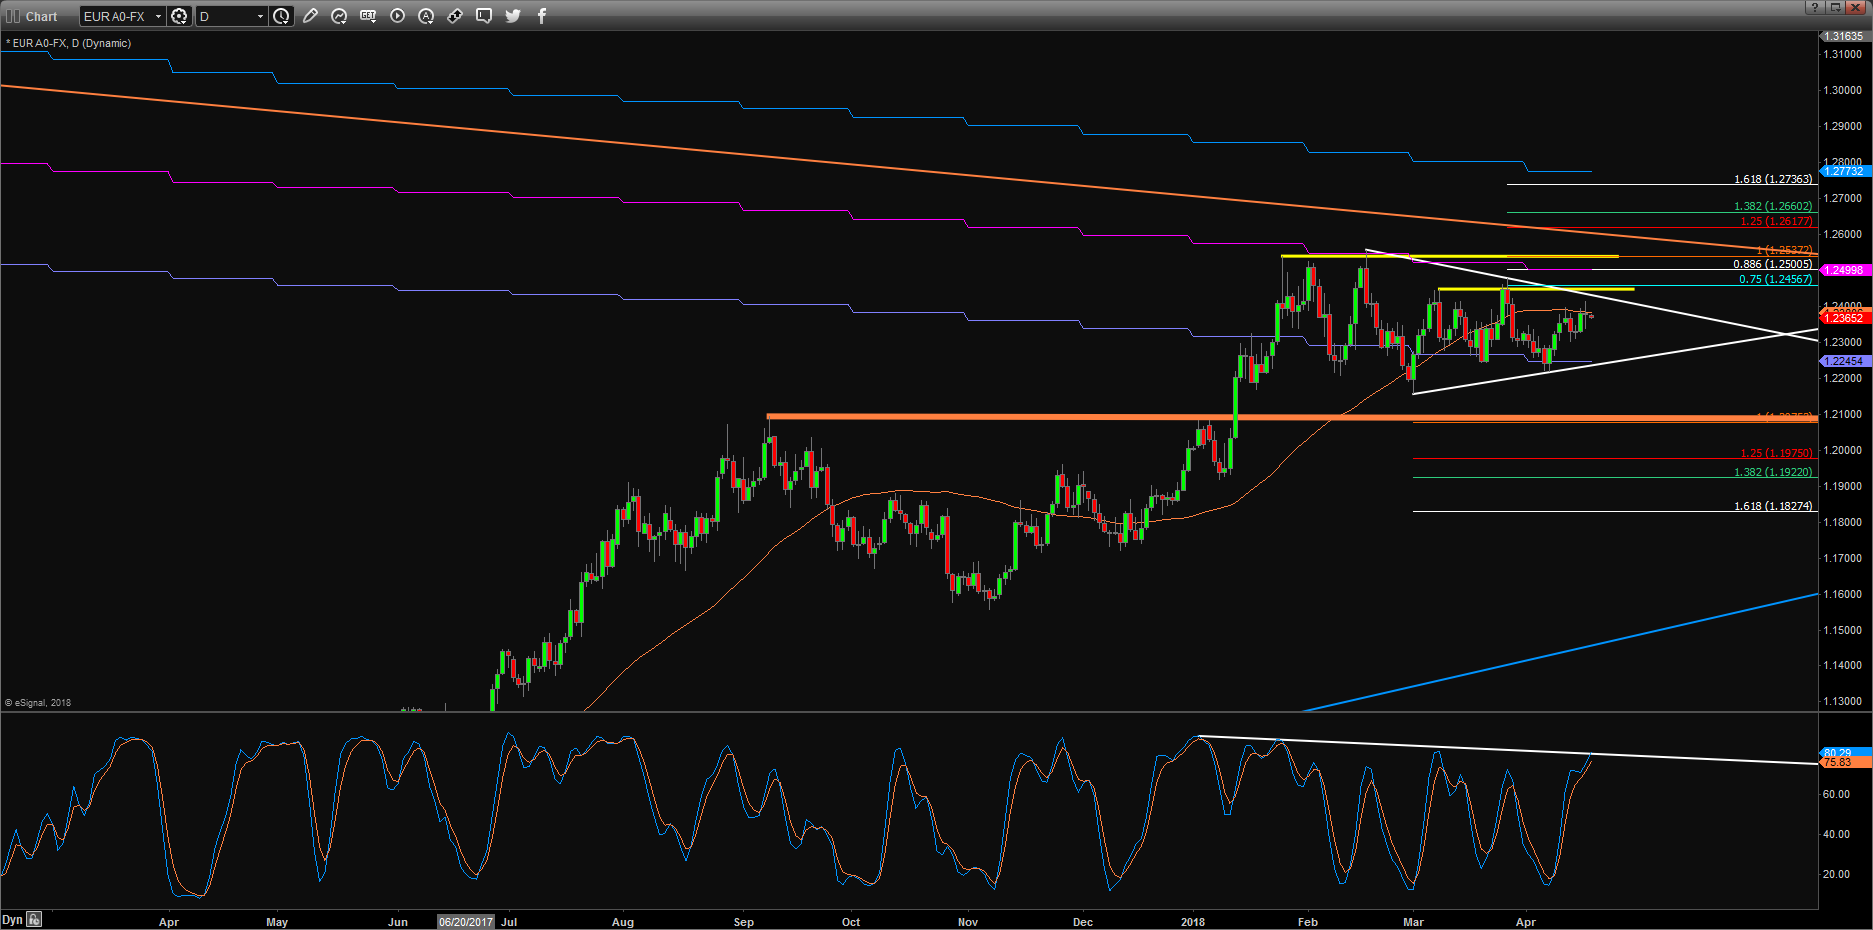
EURUSD: Further upside is likely?
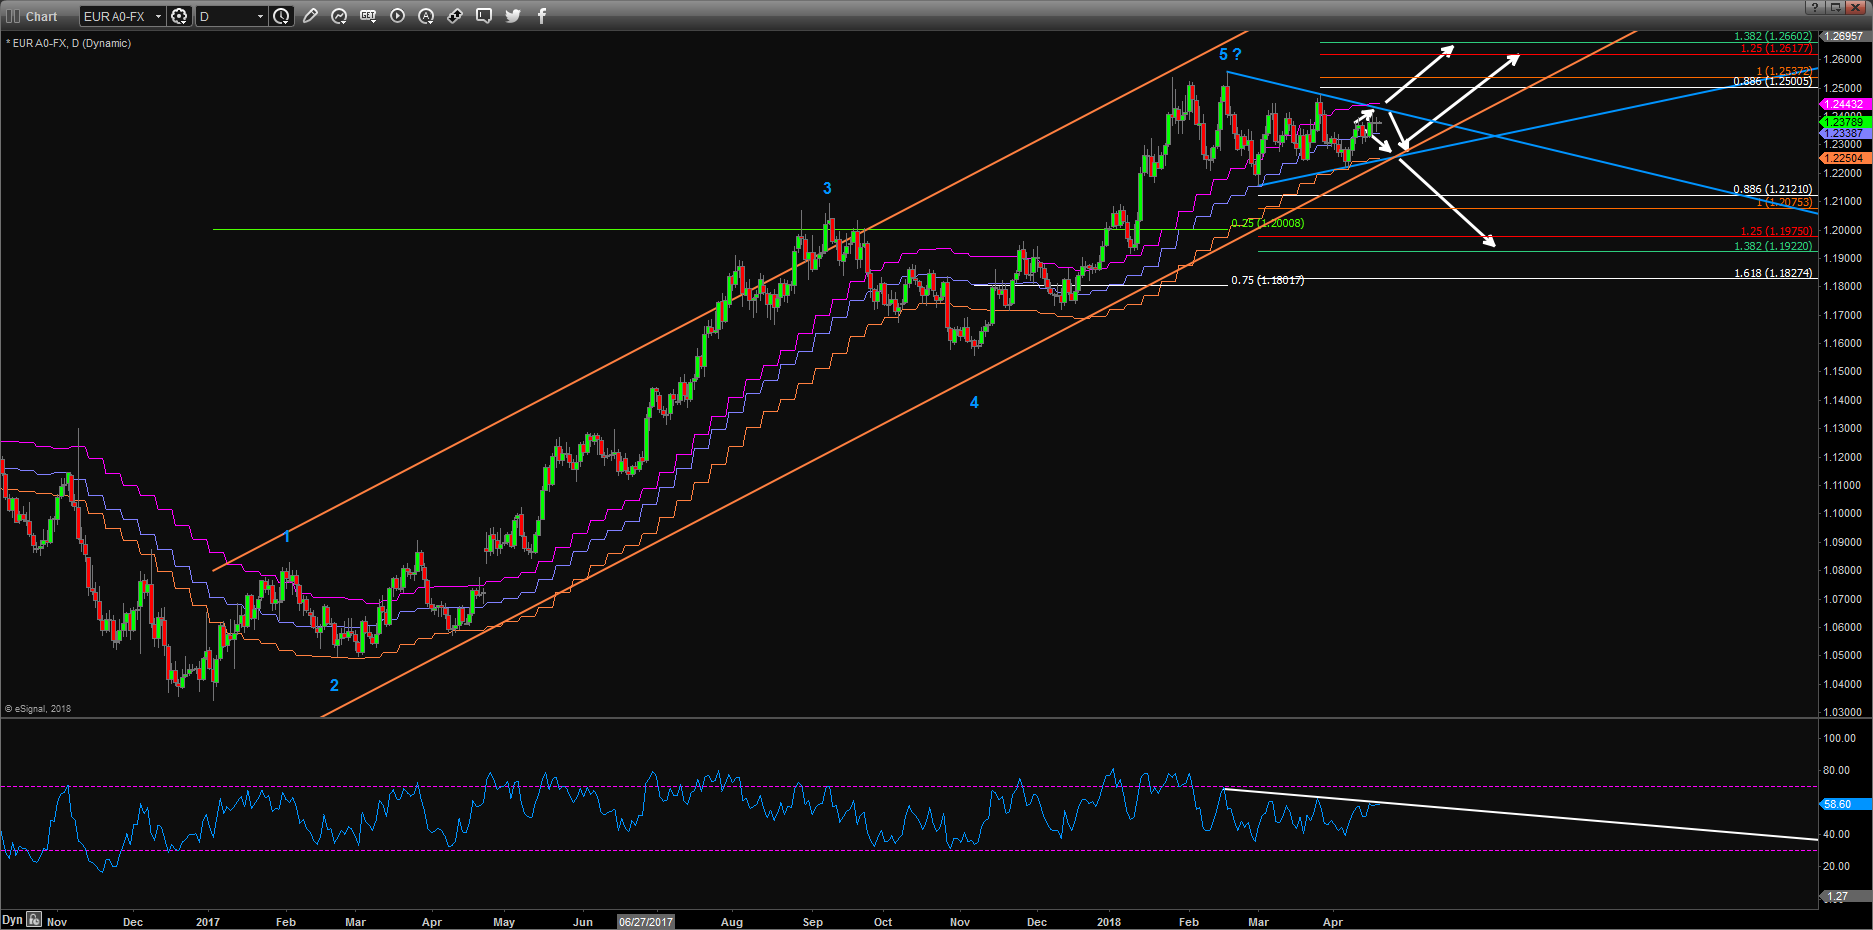
EURUSD still consolidated in the triangle.
On daily chart, we see a textbook 5 wave up from December 2016.
The price also continuous closed above daily Ichimoku cloud.
Near term overshoot to 1.2456/1.2500 could not be ruled out.
But weekly long term downtrend line is just ahead.
Unless we see a clear close above 1.2596/1.2650, upside should be limited from current level.
If today close below 1.2347, that will be the first pullback sign.
We still look to trade short term extremes and wait for directional opportunities.
EURUSD Trade Idea:
Sell limit @ 1.2424 stop 1.2461 for 1.2359

Участник с Oct 02, 2014
905 комментариев
Apr 19, 2018 at 08:36
Участник с Oct 02, 2014
905 комментариев
The Euro seems to be aiming higher. I'm looking to go short at 1.2570.
Positivity
Участник с Apr 08, 2014
1140 комментариев
Apr 19, 2018 at 10:13
Участник с Apr 08, 2014
1140 комментариев
On yesterday session, the EURUSD again went back and forward without any clear direction but closed in the green, in the middle of the daily range, in addition managed to close within Tuesdays’ range, which suggests being clearly neutral, neither side is showing control.
The currency pair is trading above the 10, the 50 and 200-day moving averages that should provide dynamic support.
The key levels to watch: a daily resistance at 1.2510, a daily resistance at 1.2432, a key level at 1.2367 (resistance), the 10-day moving average at 1.2352 (support), the 50-day moving average at 1.2323 (support), a daily support at 1.2287, a swing low at 1.2200 (support), and a key level at 1.2165 (support).
"I trade to make money not to be right."
Участник с Aug 16, 2016
24 комментариев
Apr 19, 2018 at 10:55
Участник с Aug 16, 2016
24 комментариев
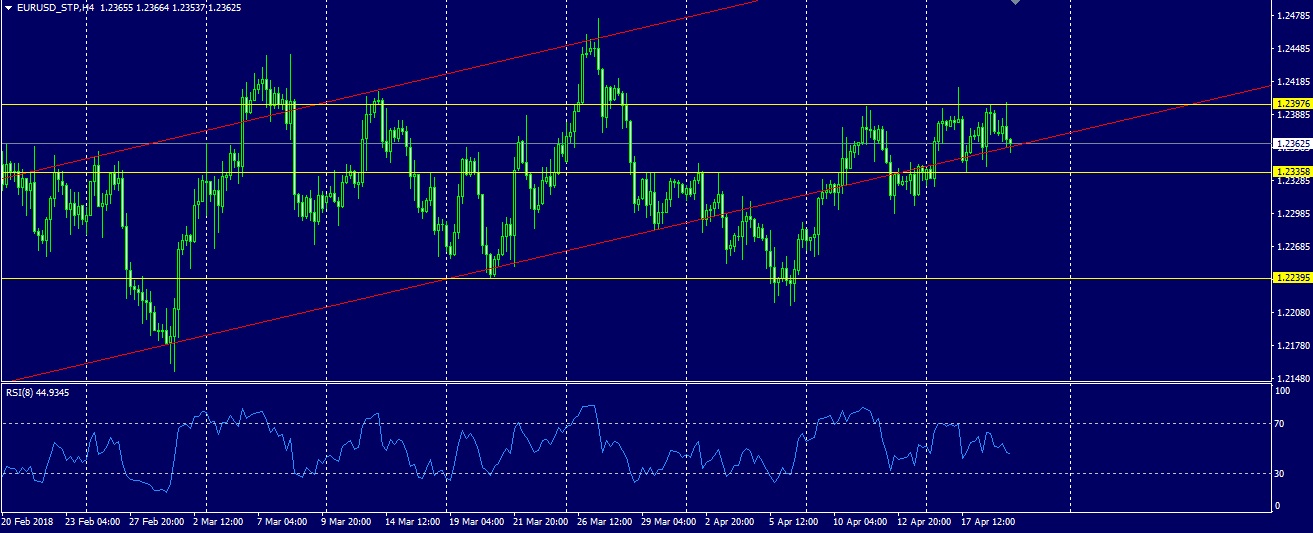
The probability of falling to 1.2336 and further to 1.2240 is growing. The graph of the currency pair is in no hurry to rise inside the uptrend.
Tension grew around the dollar in recent weeks. Trump's meeting with Japanese Prime Minister Shinzo Abe led to an agreement on intensity intensity trade consultations. I believe that this week should end positively for USD, so it is inclined to argue that the support mentioned above will be achieved. In turn, the nearest resistance for this currency pair is at the level of 1.2398
Tension grew around the dollar in recent weeks. Trump's meeting with Japanese Prime Minister Shinzo Abe led to an agreement on intensity intensity trade consultations. I believe that this week should end positively for USD, so it is inclined to argue that the support mentioned above will be achieved. In turn, the nearest resistance for this currency pair is at the level of 1.2398

Участник с Dec 10, 2017
210 комментариев
Apr 20, 2018 at 07:21
Участник с Dec 10, 2017
210 комментариев
For the second week, the price is in a range of 100 pips between 1.2395 and 1.2299. Expectations remain neutral, probably with slight downward signals. Clear break and daily / weekly closure below 1.2299 will open the doors to the important 1.2175 support. On the upside, short-term resistance is seen at 1.2395 - 1.2413.
Участник с Apr 08, 2014
1140 комментариев
Apr 20, 2018 at 08:42
Участник с Apr 08, 2014
1140 комментариев
On yesterday session, the EURUSD initially tried to rise but found enough selling pressure near 1.2400 to erase all of its gains and managed to close near the low of the day, although closed within Wednesday’s range, which suggests being slightly on the bearish side of neutral.
The currency pair is trading below the 10-day moving average that should provide dynamic resistance however, the currency pair is trading above the 50 and 200-day moving averages that should provide dynamic support.
The key levels to watch: a daily resistance at 1.2510, a daily resistance at 1.2432, a key level at 1.2367 (resistance), the 10-day moving average at 1.2351 (resistance), the 50-day moving average at 1.2323 (support), a daily support at 1.2287, a swing low at 1.2200 (support), and a key level at 1.2165 (support).
"I trade to make money not to be right."
Участник с Nov 16, 2015
708 комментариев
Apr 20, 2018 at 09:06
Участник с Nov 16, 2015
708 комментариев
EUR/USD
Key levels to watch for:
Support: 1.2348; 1.2295; 1.2215;
Resistance: 1.2393; 1.2475;
Key levels to watch for:
Support: 1.2348; 1.2295; 1.2215;
Resistance: 1.2393; 1.2475;
Участник с Feb 11, 2018
83 комментариев
Apr 20, 2018 at 10:23
Участник с Feb 11, 2018
83 комментариев
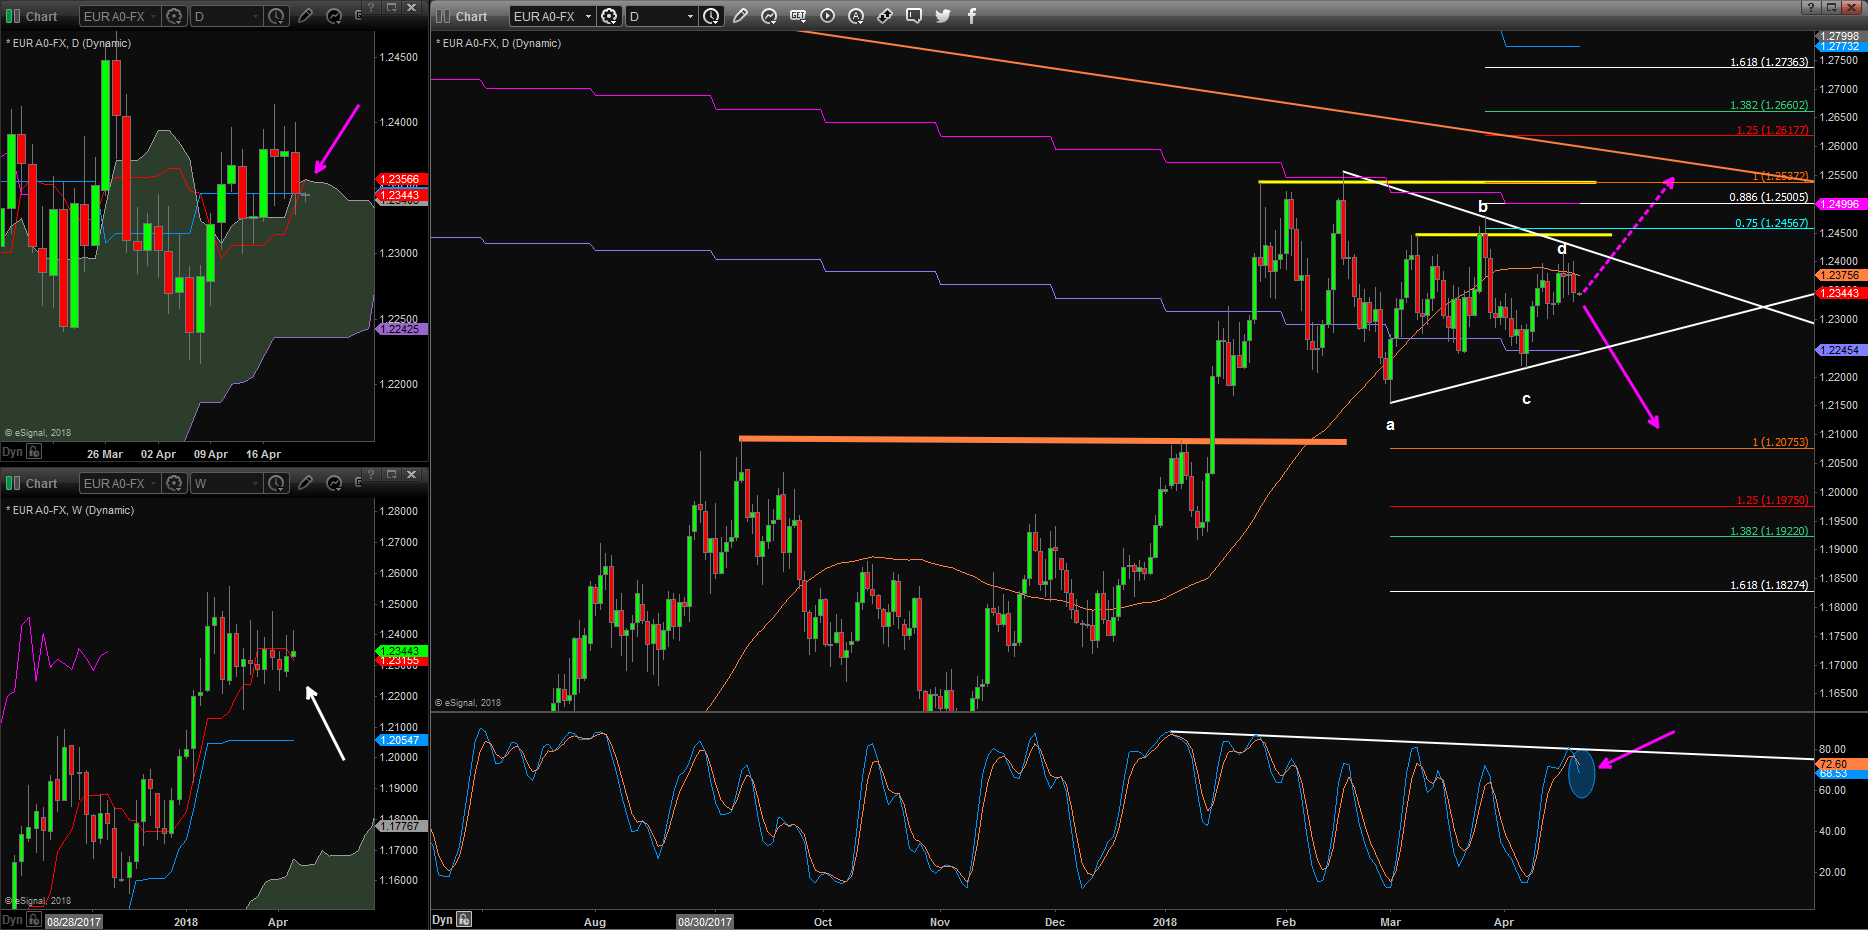
EURUSD: Time to go short again?
According to yesterday's view, EURUSD closed below 1.2347, we see short term downside risk.
Price is also probed into daily Ichimoku cloud and opened below Kijun-sen.
Daily slow stoch is cross-over and RSI is capped by downtrend line.
It's time to label 1.2413 as wave d in the triangle.
According to my system, we still in the daily buy mode; but today we have fresh daily buy signal of DXY.
So we'll try to trade EURUSD from the short side.
If today close back above 12379, will indicate uptrend resuming.
EURUSD Trade Idea:
Sell at market, spot 1.2343, add 1.2353/67 stop 1.2415 for 1.2075.
(Intraday trader may take profit @ 1.2305/15, look to re-sell next week)
Участник с Feb 11, 2018
83 комментариев
Apr 20, 2018 at 12:14
Участник с Feb 11, 2018
83 комментариев
Участник с Sep 12, 2015
1933 комментариев
Apr 20, 2018 at 14:12
Участник с Sep 12, 2015
1933 комментариев
Usually move 20-30 pips beyond the whole number to take out stops which would leave us 22800-22700 area.
"They mistook leverage with genius".
Участник с Dec 11, 2017
229 комментариев
Apr 23, 2018 at 06:48
Участник с Dec 11, 2017
229 комментариев
Eur/Usd is consolidating between 1.2300 to 1.2240 while the bearish potential is still quite clear, break the range below would confirm further downside.
Участник с Oct 02, 2014
905 комментариев
Apr 23, 2018 at 08:33
Участник с Oct 02, 2014
905 комментариев
The EUR/USD pair broke the support at 1.23 which also coincides with the 50SMA. I'm expecting more downfall.
Positivity
Участник с Apr 08, 2014
1140 комментариев
Apr 23, 2018 at 09:14
Участник с Apr 08, 2014
1140 комментариев
On the last Friday’s session, the EURUSD dived with a wide range but found enough buying pressure to trim some of its losses and closed in the middle of the daily range, although managed to close below Thursday’s range, which suggests a bearish momentum.
The currency pair trading below the 10 and the 50-day moving averages that should provide dynamic resistance however, it is trading above the 200-day moving average that should provide dynamic support.
The key levels to watch: daily resistance at 1.2432, a key level at 1.2367 (resistance), the 10-day moving average at 1.2326 (resistance), the 50-day moving average at 1.2320 (resistance), a daily resistance at 1.2287, a swing low at 1.2200 (support), and a key level at 1.2165 (support).
"I trade to make money not to be right."
Участник с Feb 11, 2018
83 комментариев
Apr 23, 2018 at 10:33
Участник с Feb 11, 2018
83 комментариев
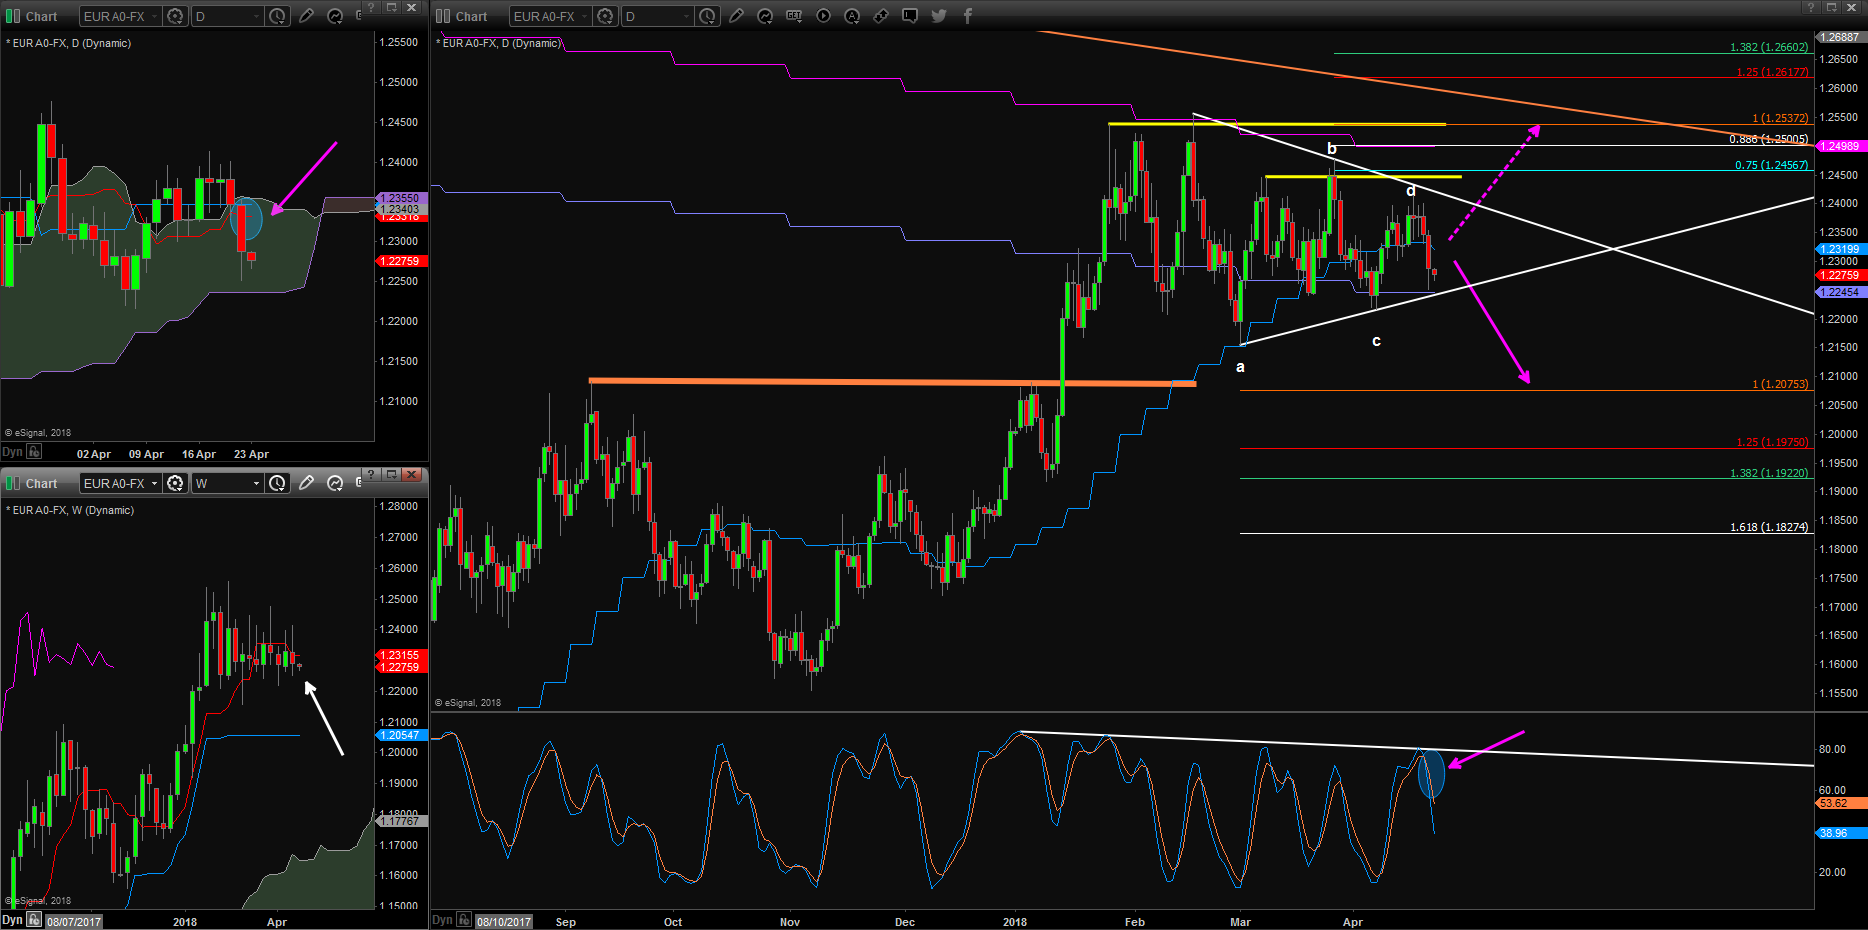
EURUSD: We stay short
EURUSD closed below daily Ichimoku Tenkan-Sen and Kijun-Sen.
Price is already in the triangle.
But US Dollar Index is closed above the downtrend line.
According to my system, we get a fresh daily sell signal after last Friday's decline.
Along with existed weekly sell mode, we translate it to a strong sell signal.
Weekly close above 1.2368 will challenge this View.
Close back above 1.2413 will negative this view.
We suggest holding short positions from 1.2343 and 1.2353 for 1.2075.
If you closed the trade at 1.2305, then we suggest looking to re-sell it at 1.2302/19.
But there's no 100% convinced trading opportunity, please well control the risk.
EURUSD Trade Idea:
①Hold short position from 1.2343/53 stop above 1.2415 for 1.2075
②Sell limit @ 1.2302 SL @ 1.2415 Take Profit @ 1.2075 (if seen, , add @ 1.2319)

Участник с Sep 12, 2015
1933 комментариев
Apr 23, 2018 at 10:56
Участник с Sep 12, 2015
1933 комментариев
Seeing some support at 1.22255 on higher time frames ,with a tight stop a Long position is small risk.
"They mistook leverage with genius".
Участник с May 18, 2015
103 комментариев
Apr 24, 2018 at 06:16
Участник с May 18, 2015
103 комментариев
Guys. I think i have the EU hack. A
My avatar explains "social trading" perfectly.
Участник с Apr 08, 2014
1140 комментариев
Apr 24, 2018 at 09:09
Участник с Apr 08, 2014
1140 комментариев
On yesterday session, the EURUSD fell with a wide range and closed near the low of the day, in addition managed to close below Friday’s low, which suggests a strong bearish momentum.
The currency pair trading below the 10 and the 50-day moving averages that should provide dynamic resistance however, it is trading above the 200-day moving average that should provide dynamic support.
The key levels to watch: daily resistance at 1.2432, a key level at 1.2367 (resistance), the 50-day moving average at 1.2318 (resistance), the 10-day moving average at 1.2311 (resistance), a daily resistance at 1.2287, a swing low at 1.2200 (support), and a key level at 1.2165 (support).
"I trade to make money not to be right."
Участник с Apr 08, 2014
1140 комментариев
Apr 25, 2018 at 09:38
Участник с Apr 08, 2014
1140 комментариев
On yesterday session, the EURUSD initially fell but found enough buying pressure near 1.200 handle to trim all of its losses and closed near the high of the day, although closed within Mondays’ range, which suggests being slightly on the bullish side of neutral.
The currency pair trading below the 10 and the 50-day moving averages that should provide dynamic resistance however, it is trading above the 200-day moving average that should provide dynamic support.
The key levels to watch: daily resistance at 1.2432, a key level at 1.2367 (resistance), the 50-day moving average at 1.2317 (resistance), the 10-day moving average at 1.2302 (resistance), a daily resistance at 1.2287, a swing low at 1.2200 (support), and a key level at 1.2165 (support).
"I trade to make money not to be right."

*Коммерческое использование и спам не допускаются и могут привести к аннулированию аккаунта.
Совет: Размещенные изображения или ссылки на Youtube автоматически вставляются в ваше сообщение!
Совет: введите знак @ для автоматического заполнения имени пользователя, участвующего в этом обсуждении.



.png)


