


Advertisement
Trade Signals, Set-ups, Charts, Trading Talks and Profitable Strategies
May 06, 2024 at 13:51
395 Просмотры
5 Replies

forex_trader_3531958
Участник с Dec 13, 2023
18 комментариев
May 06, 2024 at 13:51
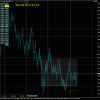
AUD/USD Trade set-up : In the 4Hour chart, price has reached the supply level once again. In case of bearish Price Action, we can consider selling AUDUSD
forex_trader_3531958
Участник с Dec 13, 2023
18 комментариев
May 06, 2024 at 15:05
AUDUSD has dropped 12 Pips since this setup was posted
forex_trader_3531958
Участник с Dec 13, 2023
18 комментариев
May 07, 2024 at 04:35
Post RBA rate event, AUDUSD has now dropped 30 Pips from the resistance level
forex_trader_3531958
Участник с Dec 13, 2023
18 комментариев
May 07, 2024 at 14:02
Potential double bottom set-up in GBPNZD which could be a trigger for traders waiting to long long

Участник с Sep 01, 2022
24 комментариев
May 09, 2024 at 18:53
YourLazyTrader posted:
AUD/USD Trade set-up : In the 4Hour chart, price has reached the supply level once again. In case of bearish Price Action, we can consider selling AUDUSD
On the weekly chart, the AUDUSD has a clear BUY entry price at 0.6667 (plus 1 pip)
The type of price bar formation is a "reverse hook entry"
Chance to stay in the trade to approx. 0.6910
Приложения:
A little bit of knowledge is a dangerous thing!

*Коммерческое использование и спам не допускаются и могут привести к аннулированию аккаунта.
Совет: Размещенные изображения или ссылки на Youtube автоматически вставляются в ваше сообщение!
Совет: введите знак @ для автоматического заполнения имени пользователя, участвующего в этом обсуждении.


