


Advertisement
how do usually draw ur support n resistance lines?!
Nov 13, 2012 at 13:13
1,137 Просмотры
6 Replies
Участник с Jun 26, 2012
183 комментариев
Nov 13, 2012 at 13:13
i mean ....
which time frame u start from?!
then u drop till which time time frame?!
how often u maintain n update ur lines?!
do u draw ur lines n line chart or candle chart?!
do u consider wicks or not?!
or u just depend in a certain indicator?! :P
lets see what u ppl r doing ;)
which time frame u start from?!
then u drop till which time time frame?!
how often u maintain n update ur lines?!
do u draw ur lines n line chart or candle chart?!
do u consider wicks or not?!
or u just depend in a certain indicator?! :P
lets see what u ppl r doing ;)

forex_trader_43716
Участник с Aug 06, 2011
326 комментариев
Nov 13, 2012 at 19:58
(отредактировано Nov 13, 2012 at 19:59)
Simple...last two "highest" highs and last two "lowest" lows. Resistance must be sloping down and support must be sloping up. Timeframe, bar chart, candle chart make no difference. Update everytime a new "highest" high or "lowest" low is formed.

Участник с Aug 24, 2012
2 комментариев
Nov 14, 2012 at 12:31
https://www.youtube.com/user/tradeadvisorpro/videos?view=0
try thous videos and u will get the picture about support and resistance levels...
try thous videos and u will get the picture about support and resistance levels...
Участник с Jun 26, 2012
183 комментариев
Nov 14, 2012 at 12:36
wow too much videos :)
Участник с Dec 04, 2012
237 комментариев
Dec 10, 2012 at 19:46
Bisho777 posted:
wow too much videos :)
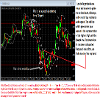
As the second poster mentioned Taking the primary high and low, then the secondary high and low (The high and low in between the highest and lowest point). It now all depends on which time frame your interested in using. I for one use 1m tf, because 1m is the best strength indicator. When a primary high or low is broken, the candle which breaks it (closes across it ) will past it by more then 8 points by the time the candle closes. Take today as an example
Приложения:

Участник с Jul 25, 2012
6 комментариев
Jan 25, 2013 at 01:30
I've ever had same question, then i browsed all long. I found Trading Structure used by Jason Stapleton is best for me.


*Коммерческое использование и спам не допускаются и могут привести к аннулированию аккаунта.
Совет: Размещенные изображения или ссылки на Youtube автоматически вставляются в ваше сообщение!
Совет: введите знак @ для автоматического заполнения имени пользователя, участвующего в этом обсуждении.


