


Advertisement
"Just Oil"

Jun 25, 2012 at 14:07
I have 2 signals. The first cross of ema's show me direction in which i am going to look for trade. Then i am waiting for good candlestick signal on daily chart. It is trend trading method but I can get speculative if there is strong signal that trend might be over.
Jun 26, 2012 at 13:45
Somtimes I look for the Moving Averages to show me were i can expect support and resistance, but I never look for candlestick patterns, most of the time i take my trades based on simple chart drawings and speculative positions when I feel there is a strong momentum going on. But I realise I have to broaden my horizon and learn some new techniques.
Tell me: on what basis did you took the $/Yen and $/CHF long position?
Tell me: on what basis did you took the $/Yen and $/CHF long position?
Jun 26, 2012 at 16:59
Ok, both pairs had ema's cross . missed foirst entry on usd/chf, better one. waited for pull back but was not here when it happened so entered about 15-20 pips at worse price. according to EMA's it is in uptrend.
so is USD/JPY, however there was not any candlestick formation so I simply waited for it to come down to support level and show that there is interest there so I bought. also, usd/jpy made higher low on daily last week. so, by all means it is in up trend now.
I am on the verge to close gbp/usd at loss before stop. Ema's touching and if they cross against me I will close the trade. also 1.5650 is an upper boundary of resistance area created before on daily.

forex_trader_79941
会员从Jun 06, 2012开始
1434帖子
Jun 27, 2012 at 22:56
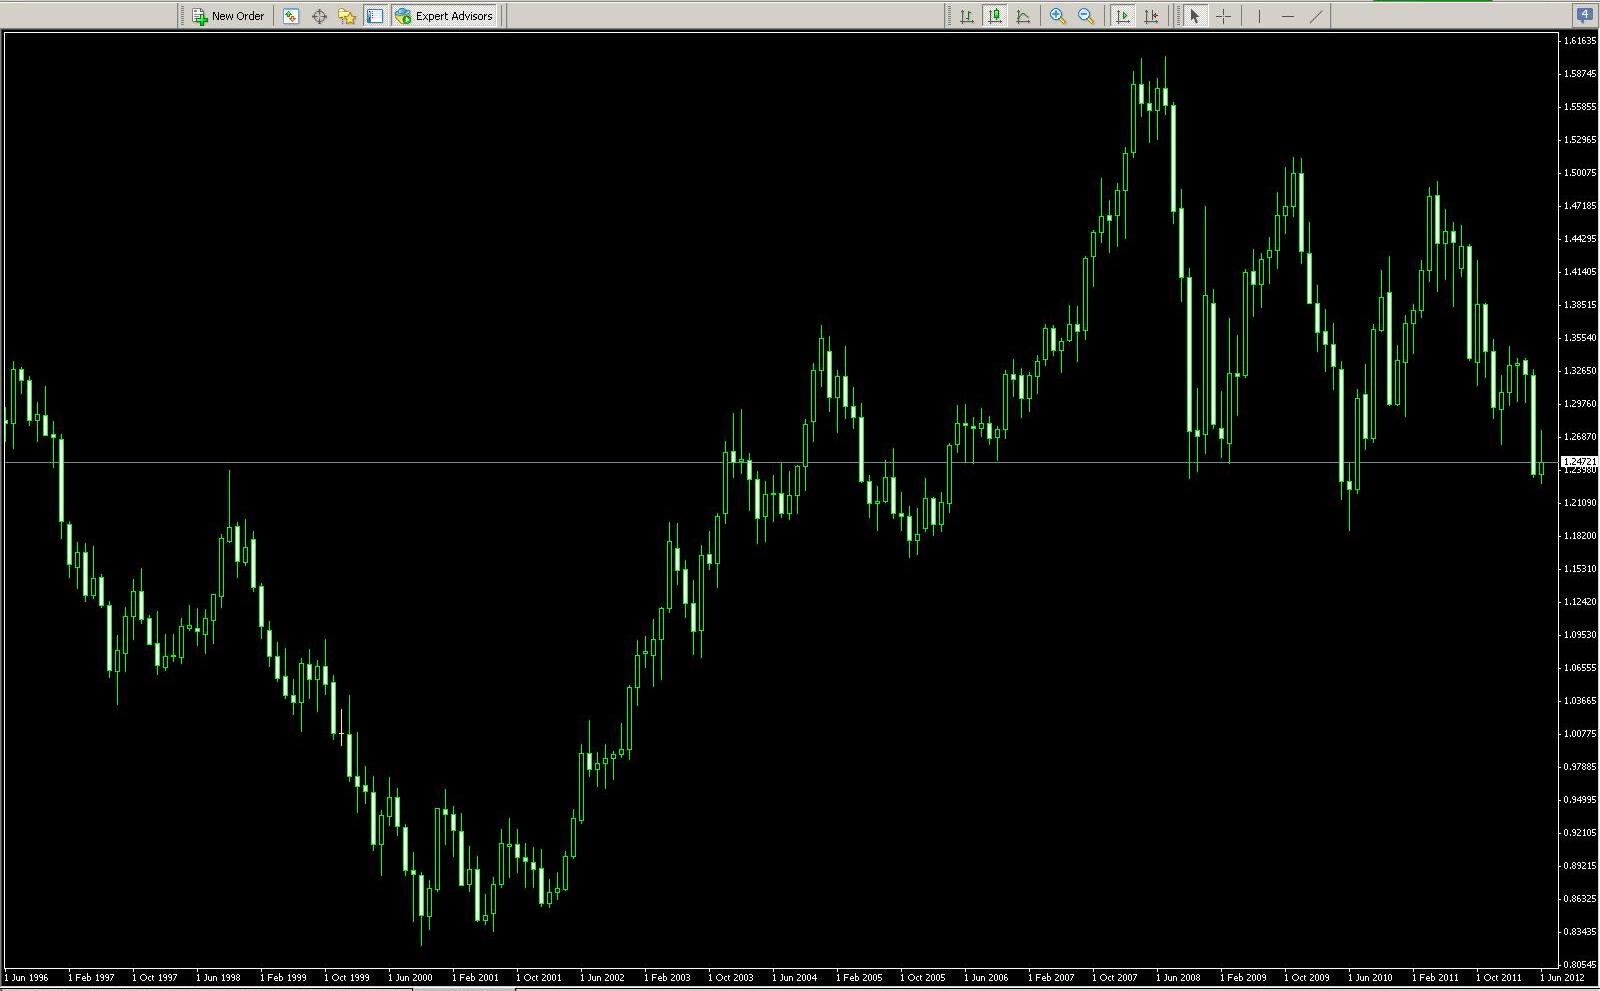
when you look at monthly chart last 2-3 years bars are extreemly big. this is giving big opp on daily charts with big pips
daily there are up/down moves that break trends when coded, but manually that can be achived as you do.
daily there are up/down moves that break trends when coded, but manually that can be achived as you do.
Jun 28, 2012 at 08:35
Today is the last day I cannot follow my trades continuously. will be leaving as usually at 5;30 a.m. EST and be back after 2:00 p.m. est. will not be able to check on what will be going as today a lot of US and other Euro news. started taking profits and moved stop on e/u to be -2-3 pips. level looks just right and above 2 previous up waves.
Jun 28, 2012 at 08:46
(已编辑 Jun 28, 2012 at 08:46)
stevewalker posted:
when you look at monthly chart last 2-3 years bars are extreemly big. this is giving big opp on daily charts with big pips
daily there are up/down moves that break trends when coded, but manually that can be achived as you do.
yeah Steve, those were most probably 2008-2010 years. there were huge trends and many could trade from just 1H and get big pips. but currently 1H is just a noise. market is in frog mode. consolidate consolidate for a long time than jump, jump.
forex_trader_79941
会员从Jun 06, 2012开始
1434帖子
Jun 28, 2012 at 10:01
gbpchf one of the most active pair. fyi
forex_trader_79941
会员从Jun 06, 2012开始
1434帖子
Jun 28, 2012 at 11:14
great statistics
average win/loss pips
win ratio
keep up the good work😄
walker
average win/loss pips
win ratio
keep up the good work😄
walker
Jun 28, 2012 at 14:13
minosd777 posted:
Your going live already? Good luck then! I hope we can continue to follow your trades or will you close your page for public?
One question about the EMA: does it makes any difference on which timeframe you look at them?
I am obviously going to keep everything public as I am looking to reach level when i can join one of those firms of investors companies that are looking for money managers.
I am trading from daily time frame.


