Advertisement
Supply&Demand Price Action By The5ers Prop trading Fund

Jan 27, 2019 at 14:50
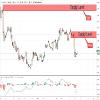
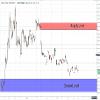
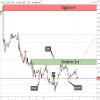
After a long stamping, the XAUUSD price finally broke out the resistance at 1297.00 zones and creates a new fresh demand which I marked below, it seems the price tends to reach the supply Level from the left at 1315.00 zones, we can see that on a daily chart, the demand below is a great continuation level of buy position, as long as the price didn’t reach 1315.00 zones, I’ll Buy at the demand below and the target will be 1315.00 zones,
附件:
We fund the top 5% forex traders
Jan 29, 2019 at 07:24
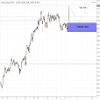
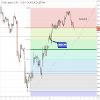
I have marked on the chart the Compression area in a channel, as we can see the USDCHF price now goes against that compression area from the left, Compression is a situation Where the price moves up or down easily and slowly, picks all the orders on his way, struggling to move up or down, when the price goes against Compression it usually safer, above Us, there is a great supply level, I'll sell at this supply if the price retrace there and my target will be the demand below.
附件:
We fund the top 5% forex traders
Jan 31, 2019 at 15:19
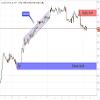
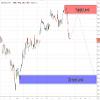
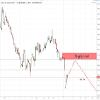
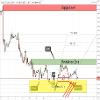
As we can see, the supply level I marked on the USDJPY chart is a new fresh one, the price drop from that level which indicates on unfilled orders still waiting there, Therefore, if the price will That supply I'll sell there, my final target will be at 105.50 zones,
附件:
We fund the top 5% forex traders
Feb 04, 2019 at 08:20
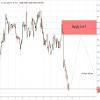
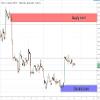
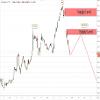
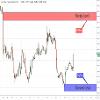
The BTCUSD price is just about to hit a great demand soon, I'll buy in the first touch in this demand, and the target for this position will be the supply above which is a great supply For sell position, both levels are relevant for swing traders,
附件:
We fund the top 5% forex traders
Feb 10, 2019 at 07:56
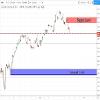
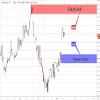
As we can see in the attached picture, the DAX index drop down from the last high and create a lower low in one movement, that drop created a new fresh supply above which is the Quasimodo level, I’ll wait for the price to return back that supply and I’ll sell there, my target for this swing position will be the demand below,
附件:
We fund the top 5% forex traders
Feb 15, 2019 at 13:02
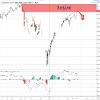
As we can see, the demand below has changed the BTCUSD momentum from bearish to bullish , the price broke out the last high of the bearish momentum, as The price compressing down toward the fresh demand below, I'll sit and wait for the price at the demand below, if the price reach that demand I'll buy there. My target will be the supply above which is also a great level for sell position.
附件:
We fund the top 5% forex traders
Feb 21, 2019 at 10:50
Those are the next levels to look for a position on USDCHF , the supply above is a great level for sell position, if we look carefully, we can see that is the price Will move up toward the supply now, it might create the right shoulder of Head and Shoulders pattern. the target for the sell position will be the demand Below, which is a great demand for buy position.
附件:
We fund the top 5% forex traders
Mar 13, 2019 at 07:14
For the long term traders and the swingers among us, the EURUSD is bearish at the moment, which means, I’ll prefer to look for sell opportunity, It seems the Price on his way to reach 1.0900 zones, the supply above seems like a great continuation level for sell position, for now, it looks like the price compress Toward this supply, I’ll sell at this supply on the first touch and my target will be 1.0900 zones.
附件:
We fund the top 5% forex traders
Mar 21, 2019 at 07:00
In 15 minutes chart on the DAX index, we can see a possibility of Head & Shoulders pattern to be created, if the price won’t break out the neckline which is Where the price now, and start to move up toward the supply above I’ll sell at this supply, I’ll sell there particularly because it’s a supply with sell orders Waiting there, but also because it can complete the right shoulder of the Head & Shoulders pattern,
BTW- if the price will break out the supply above I’ll sell again at the supply at the top.
BTW- if the price will break out the supply above I’ll sell again at the supply at the top.
附件:
We fund the top 5% forex traders
Apr 02, 2019 at 07:29
A gap in the price can indicate sometimes on supply or demand levels, usually, the price tends to close gaps, for the long terms the DAX index seems to be in bearish momentum, both Levels, the supply above and the demand below start with a gap, and both are great levels to look for position, I’ll sell at the supply and I’ll buy the demand, that’s the meaning of sell high and buy low, my target for the buy position will be the supply above, and the target for the sell position will be 11040.00 zones.
附件:
We fund the top 5% forex traders
Apr 05, 2019 at 06:03
First, SPX500 just arrived into supply level, Last time the price reach that level was in October 2018, that level is the record for SPX500 and the price drop from that level, also, we can see a very clear divergence between the MACD indicator and the price, by the time the price creates higher high, the MACD shows lower high, that divergence indicates that this Recent uptrend is powerless, in one of my previous post on SPX500 this level seems also like a Quasimodo level on a weekly chart, bottom line – it’s a great level to sell SPX500 as a Long term position.
附件:
We fund the top 5% forex traders
Apr 08, 2019 at 06:25
It seems the bearish trend in the 1Hour chart has ended, the price now start to creates Head & Shoulders pattern, which is usually a reversal pattern, for now, the pattern is almost Completed, if the price will breakout the confirmation zone which is also the neckline of the pattern, it indicates the price tends to reach the supply above, in case the price will break The resistance above I’ll look for price action setup for buy position, the target will be the supply at the top which is also a great supply of sell position,
附件:
We fund the top 5% forex traders
Apr 09, 2019 at 05:50
Usually, when the price is in bullish momentum, the only thing that can stop this momentum is a strong supply level with a massive amount of unfilled orders, on a daily chart on USDJPY, we can see that the next fresh supply is only at 113.00 zones, therefore, I believe that in the long terms the price tends to reach there and for that reason I'll look for a Continuation level to join this momentum, the demand below seems like a great demand for buy position as a continuation trade, it is also 0.382 Fibonacci level, the combination of These two reasons creates a great opportunity for buy position, I'll at 0.382 Fibonacci level, and my final target will be 113.00 zones,
附件:
We fund the top 5% forex traders

Apr 11, 2019 at 10:40
The key levels that marked on the chart are the next fresh supply and demand for now, each one of those levels seems to hold unfilled orders, and each one of them is a great level for Position on the first touch, I'll buy if the price hit the demand below, and sell if the price hit the supply above, that's the meaning of "buy low and sell high", for both position the target Will be the opposite level, the target for the buy position will be the supply above and vise verse,
附件:
We fund the top 5% forex traders
Apr 15, 2019 at 12:17
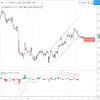
In 1 Hour chart, we can see the GOLD is in an uptrend which creates a clear channel, we can also see a very clear divergence between the price and the MACD indicator, this Divergence indicates that this uptrend became more and more powerless, this situation can create a reversal opportunity, now we just need to wait and see if the price will break down This uptrend channel, if that happened, it’s a sign to look for price action setup for sell position, the first target for this position will be the support zone at 1280.00, and the final Target will be 1250.00 zone
附件:
We fund the top 5% forex traders
Apr 16, 2019 at 10:41
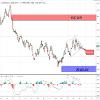
As we can see on the 1D chart, the GBPUSD is assembling and creates a triangle pattern, soon, the price will have to break out this pattern, the question is if the price gonna break this Triangle up or down, The divergence (red dot lines on the chart) between the price and the MACD indicator indicates of high probability that the price will breakout toward down the Triangle pattern, but, it can be also up, the best way to act now is to wait and see, if the price will breakout toward up it indicates the price on his way to reach the supply above, in that Case, I’ll look for price action setup of long term buy position, in case the price will breakout toward down, I’ll look for price action setup of long term sell position, the target for the Buy position will be the supply above, and for the sell position it will be the demand below, both positions have a potential of 600-700 pips of profit.
附件:
We fund the top 5% forex traders