


Advertisement
Swing Trading Analysis & Results

会员从Nov 19, 2014开始
157帖子
Nov 29, 2015 at 17:43
(已编辑 Nov 29, 2015 at 17:48)
Hey all,
November was the first month of testing additional Swing Trading Strategies that are the more aggressive versions of the current Methodology I now use/shown in this thread. Combined, the trades made provided a Return of 19% from just 5 trades with most coming from Consolidation Setups. All follow a certain set of rules based on the setup seen and were not random trades made.
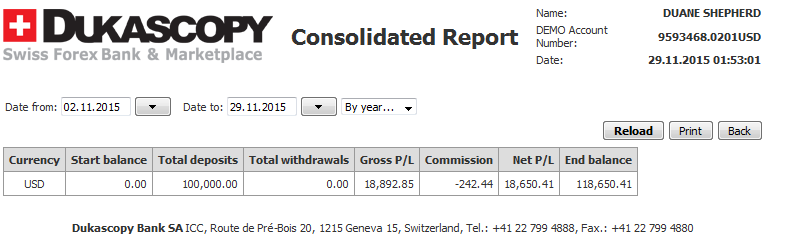
This was done on a Demo of the Dukascopy Platform. Once the results continue to be good, you will see these in a Live Account on a platform that can be tracked and verified by Myfxbook (not possible with my Dukascopy Live Account - platform doesnt support myfxbook).
The goal of the thread and trades that you will now see from now on, will therefore be aimed at showing and discussing;
1. The use of Candlestick Patterns and Signals in identifying trades
2. Daily and 4 Hour Time Frames
3. Holding Periods for Trades
4. When to abandon a trade
5. Identifying Trading Targets, especially for Consolidation Breakouts
6. How many trades to have open at the same time
7. Using Correlations between Currencies to your advantage
8. General Guidelines to follow when trading
TRADING STRATEGIES
These strategies target 150 Pips per trade on average (100 to 200 Pips) as they take advantage of Weekly Range movements across the currency market each week. On average, there are 8 of these moves that take place every month. So if you aimed to capture just 2 of these each week, you will be able to generate Large Rates of Return on your Account each month.
STRATEGY 1 - Trading Strong Consolidation Breakouts and Trends
STRATEGY 2 - Trading Slow Consolidation Breakouts
STRATEGY 3 - Trading Within Consolidations Using Daily Chart Signals
STRATEGY 4 - Trading Within Consolidations Using only Support & Resistance for Entry
STRATEGY 5 - Trading Within Consolidations Using 4 Hour Signals
TRADE 1 - GBP CAD - STRATEGY 4
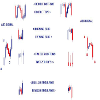
This pair began to move sideways for a few days and eventually formed a small Range Setup on the 4 Hour Chart
On November 2, having determined that the setup and signals on the Daily and 4 Hour Charts were in sync with the criteria for this strategy, a short position was opened just below Resistance.
The target was set to the Support boundary for a planned gain of 120 Pips but was exited for a gain of 102 Pips as the market had not yet hit that target by the end of the established holding period.
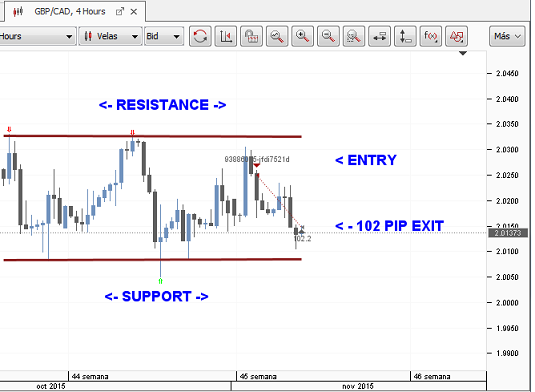
As can be seen in the Video, the decision to exit instead holding out for the extra 20 Pips was the correct one.
With this Swing Trading Methodology, you have to obey the rules related to the length of time that we remain in a trade. This helps to keep your trading objective so that your temptation to capture additional Pips does not compromise your success and long-term profitability.

November was the first month of testing additional Swing Trading Strategies that are the more aggressive versions of the current Methodology I now use/shown in this thread. Combined, the trades made provided a Return of 19% from just 5 trades with most coming from Consolidation Setups. All follow a certain set of rules based on the setup seen and were not random trades made.
This was done on a Demo of the Dukascopy Platform. Once the results continue to be good, you will see these in a Live Account on a platform that can be tracked and verified by Myfxbook (not possible with my Dukascopy Live Account - platform doesnt support myfxbook).
The goal of the thread and trades that you will now see from now on, will therefore be aimed at showing and discussing;
1. The use of Candlestick Patterns and Signals in identifying trades
2. Daily and 4 Hour Time Frames
3. Holding Periods for Trades
4. When to abandon a trade
5. Identifying Trading Targets, especially for Consolidation Breakouts
6. How many trades to have open at the same time
7. Using Correlations between Currencies to your advantage
8. General Guidelines to follow when trading
TRADING STRATEGIES
These strategies target 150 Pips per trade on average (100 to 200 Pips) as they take advantage of Weekly Range movements across the currency market each week. On average, there are 8 of these moves that take place every month. So if you aimed to capture just 2 of these each week, you will be able to generate Large Rates of Return on your Account each month.
STRATEGY 1 - Trading Strong Consolidation Breakouts and Trends
STRATEGY 2 - Trading Slow Consolidation Breakouts
STRATEGY 3 - Trading Within Consolidations Using Daily Chart Signals
STRATEGY 4 - Trading Within Consolidations Using only Support & Resistance for Entry
STRATEGY 5 - Trading Within Consolidations Using 4 Hour Signals
TRADE 1 - GBP CAD - STRATEGY 4
This pair began to move sideways for a few days and eventually formed a small Range Setup on the 4 Hour Chart
On November 2, having determined that the setup and signals on the Daily and 4 Hour Charts were in sync with the criteria for this strategy, a short position was opened just below Resistance.
The target was set to the Support boundary for a planned gain of 120 Pips but was exited for a gain of 102 Pips as the market had not yet hit that target by the end of the established holding period.
As can be seen in the Video, the decision to exit instead holding out for the extra 20 Pips was the correct one.
With this Swing Trading Methodology, you have to obey the rules related to the length of time that we remain in a trade. This helps to keep your trading objective so that your temptation to capture additional Pips does not compromise your success and long-term profitability.
附件:
Trade Less, Earn More
会员从Nov 19, 2014开始
157帖子
Nov 29, 2015 at 18:21
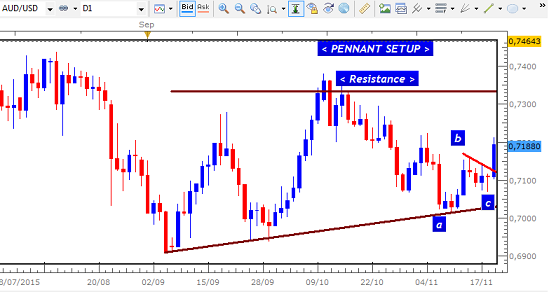
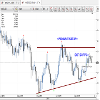
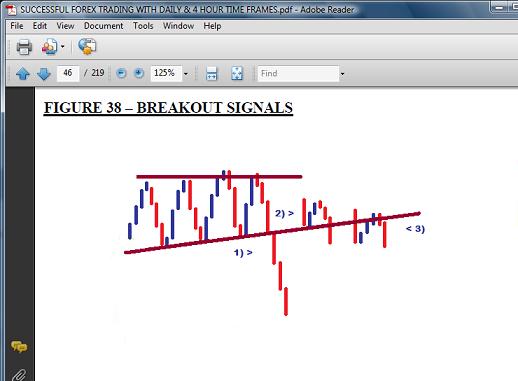
TRADE 2 - USD CHF CONSOLIDATION BREAKOUT - STRATEGY 1
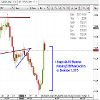
This trade attempted to take advantage of the breakout from a large Consolidation Pennant Setup on the Daily Chart on November 17.
The breakout took place at the Resistance boundary and was expected to continue higher as the Uptrend became stronger.
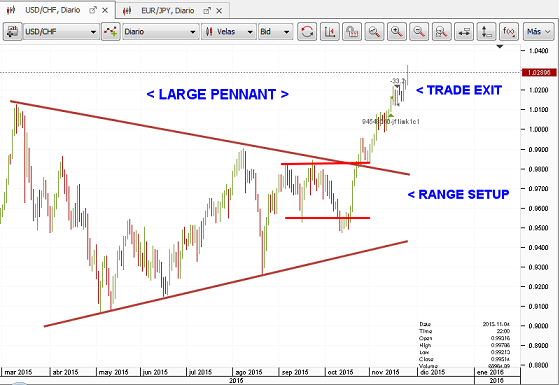
However, the trade was exited for a small loss of 35 Pips when it was realized that an important target on the 4 Hour Chart was overlooked.
The target for this trade was set to the Breakout Equivalent of the Range Setup that started the overall breakout. This B.E. area was at the 1,0350 area and would have provided a gain of 190 Pips. The Breakout Equivalent is the area I have identified as where breakouts from Consolidations head to before pulling back. This helps in eliminating the uncertainty of where to exit our trades during the fast but tricky moves.
However, it was later realized that the Breakout Equivalent of the 4 Hour Chart’s Range was at the 1,0200 area and would have led to a pullback - customary at these areas - before that 1,0350 target was reached.
Despite the fact that the market was expected to continue higher after this pullback, it was uncertain whether or not it would now do so within the holding period and without taking out the Stop Loss. This led to the reluctant but necessary decision to exit for the small loss.
Mistakes and oversights like these take place from time to time and are par for the course. The key is to ensure that they are not repeated and that we meticulously analyze all aspects of the time frames before trading.
This trade attempted to take advantage of the breakout from a large Consolidation Pennant Setup on the Daily Chart on November 17.
The breakout took place at the Resistance boundary and was expected to continue higher as the Uptrend became stronger.
However, the trade was exited for a small loss of 35 Pips when it was realized that an important target on the 4 Hour Chart was overlooked.
The target for this trade was set to the Breakout Equivalent of the Range Setup that started the overall breakout. This B.E. area was at the 1,0350 area and would have provided a gain of 190 Pips. The Breakout Equivalent is the area I have identified as where breakouts from Consolidations head to before pulling back. This helps in eliminating the uncertainty of where to exit our trades during the fast but tricky moves.
However, it was later realized that the Breakout Equivalent of the 4 Hour Chart’s Range was at the 1,0200 area and would have led to a pullback - customary at these areas - before that 1,0350 target was reached.
Despite the fact that the market was expected to continue higher after this pullback, it was uncertain whether or not it would now do so within the holding period and without taking out the Stop Loss. This led to the reluctant but necessary decision to exit for the small loss.
Mistakes and oversights like these take place from time to time and are par for the course. The key is to ensure that they are not repeated and that we meticulously analyze all aspects of the time frames before trading.
附件:
Trade Less, Earn More
会员从Nov 19, 2014开始
157帖子
Nov 29, 2015 at 18:40
(已编辑 Nov 29, 2015 at 18:45)
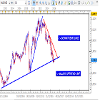
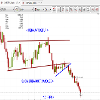
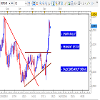
TRADE 3 - AUD USD - TRADING WITHIN CONSOLIDATION USING DAILY CHART SIGNALS
In this trade on November 19, the Daily Chart had provided us with a strong bullish ABC Signal above the Support of the Pennant to start heading back to Resistance at 0,7310.
Based on the characteristics of this setup, the Daily Chart was needed to give us the signal to trade instead of the 4 Hour Chart or entering at the Support boundary.
(FXCM Charts are used to provide Chart Signals based on the New York Close of the Daily Candle)
ABC signals are among those that lead to very fast breakouts across the currency market. Once spotted and traded, these signals tend to provide hundreds of Pips in gains within a very short period of time.
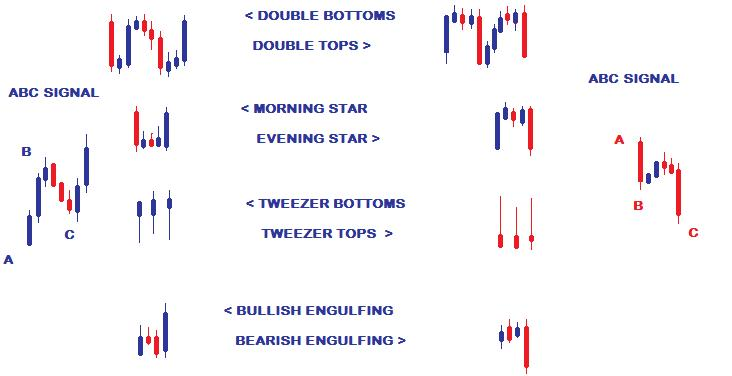
Given this strong ABC Signal, therefore, this trade was expected to hit the target unhindered. However, by the end of the holding period, the trade had to be closed as the pair began to stall at one of the Downtrend Line that has defined the bearish direction of this pair.
Usually these trend lines are ignored once the pair is headed to the other side of a Consolidation but this was one of those instances in which they held firm
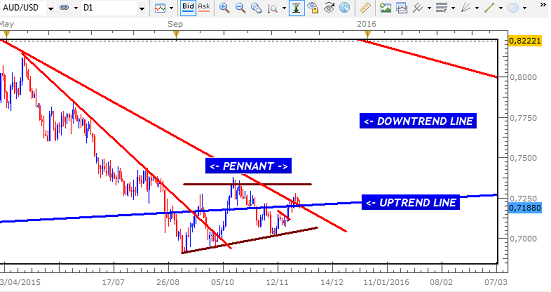
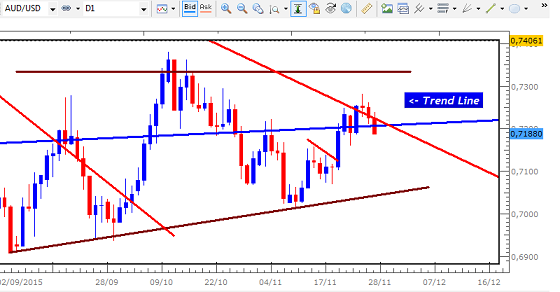
This trade was another example of the importance of closing trades early once the holding period has expired. A small gain of 23 Pips is always better than a loss and as you can see from the pullback that has started, this is what is likely to have taken place in the days ahead.

In this trade on November 19, the Daily Chart had provided us with a strong bullish ABC Signal above the Support of the Pennant to start heading back to Resistance at 0,7310.
Based on the characteristics of this setup, the Daily Chart was needed to give us the signal to trade instead of the 4 Hour Chart or entering at the Support boundary.
(FXCM Charts are used to provide Chart Signals based on the New York Close of the Daily Candle)
ABC signals are among those that lead to very fast breakouts across the currency market. Once spotted and traded, these signals tend to provide hundreds of Pips in gains within a very short period of time.
Given this strong ABC Signal, therefore, this trade was expected to hit the target unhindered. However, by the end of the holding period, the trade had to be closed as the pair began to stall at one of the Downtrend Line that has defined the bearish direction of this pair.
Usually these trend lines are ignored once the pair is headed to the other side of a Consolidation but this was one of those instances in which they held firm
This trade was another example of the importance of closing trades early once the holding period has expired. A small gain of 23 Pips is always better than a loss and as you can see from the pullback that has started, this is what is likely to have taken place in the days ahead.
附件:
Trade Less, Earn More
会员从Nov 19, 2014开始
157帖子
Nov 29, 2015 at 19:01
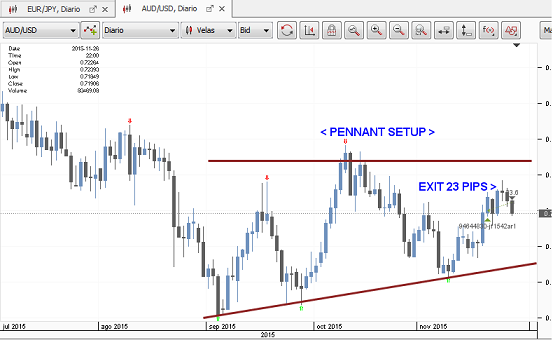
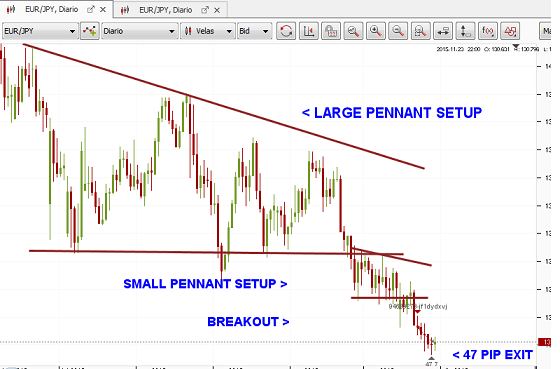
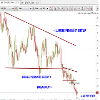
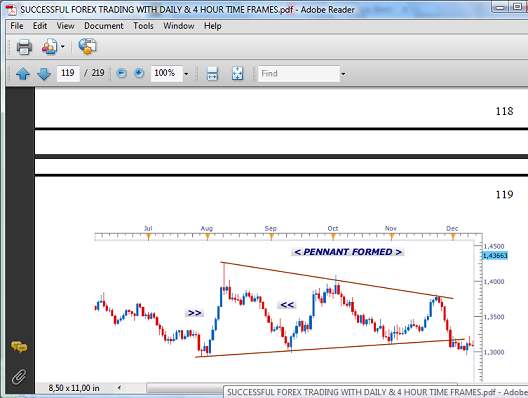
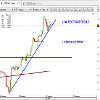
TRADE 4 - EURO JPY CONSOLIDATION BREAKOUT STRATEGY 1
On November 20, a strong signal was given on the Daily Chart to start a sharp breakout from the Pennant Setup.
This was expected to provide sharp gains in favour of the Japanese Yen heading into December as the Euro continued to lose ground across the Forex.
The initial break of Support was followed by a brief period of sideways movement that formed a small Pennant Setup. This was a way of "testing" the boundary before continuing the breakout with the bearish signal.
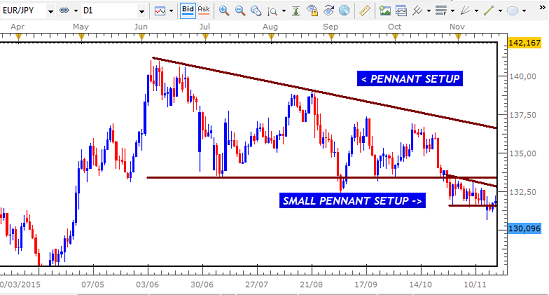
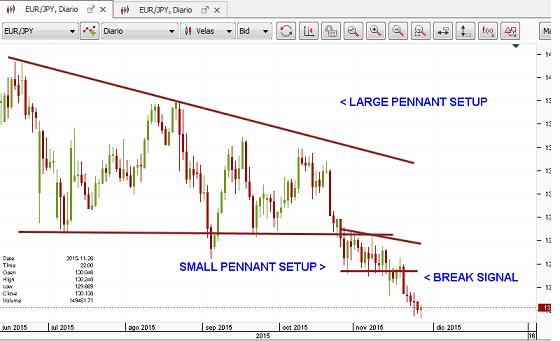
A target of 172 Pips was set at the Breakout Equivalent of this smaller Pennant but due to the lack of market activity during this holiday period, the trade was only up by 47 Pips - smaller than expected but a win nevertheless.
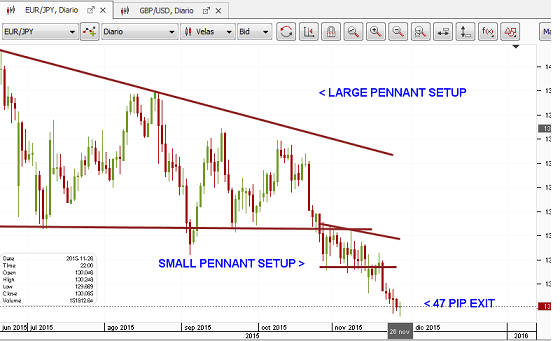
In situations such as this, re-entry is possible once liquidity returns to the market and the signal is strong enough to justify trading it to the original target.
附件:
Trade Less, Earn More
会员从Nov 19, 2014开始
157帖子
Nov 29, 2015 at 19:21
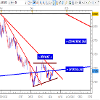
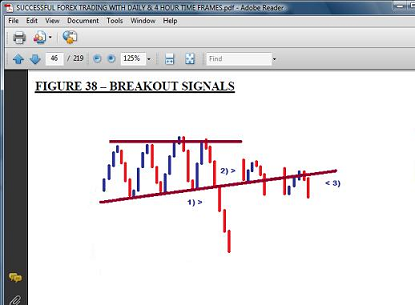
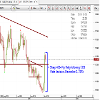
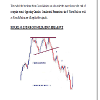
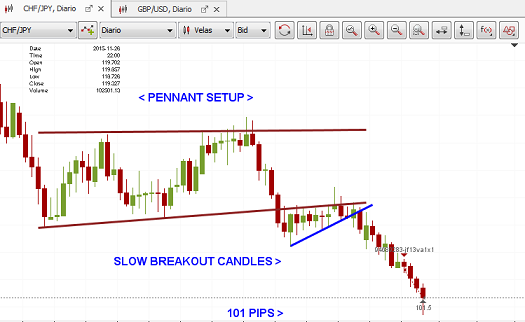
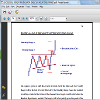
TRADE 5 - CHF JPY - SLOW BREAKOUT - STRATEGY 2
This new trading strategy takes advantage of breakouts that would have otherwise have been ignored given the small nature of the candles that often lead to unexpected reversals. However, it has been now been realized that these can be very profitable once we are able to distinguish between those that lead to these reversals and those that successfully hit their targets.
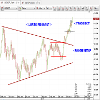
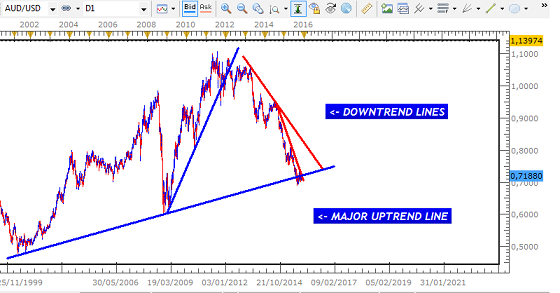
On November 21, this pair provided such an opportunity with a signal to indicate the resumption of the breakout that started back in October. The expected breakout was in keeping with the new Downtrend that was formed as the pair continued to break farther below the major Uptrend Line in place since 2012.
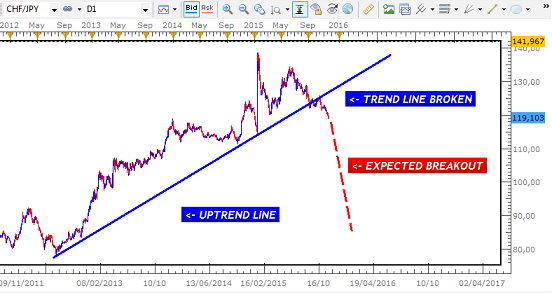
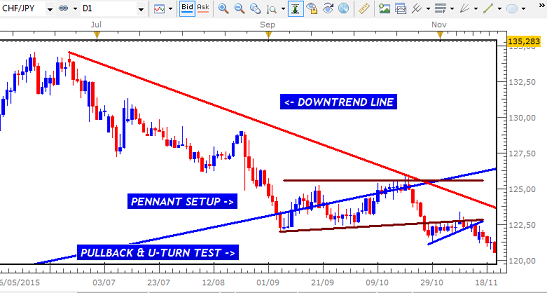
This was another example of the market pulling back to "test" the broken boundary before U-Turning to resume the breakout. It is one of the three common ways in which the market can start breaks from these setups (3).
The target of 172 Pips was set to coincide with the Breakout Equivalent of this Pennant but at the end of the holding period, the market had come very close to the Limit Order before pulling back to close the last day at 101 Pips.

The candles that continued the breakout were small as expected but they still moved by over 100 Pips to confirm that these would be the ones that offered profitability. Once again, this was a trade that had to be closed early in order to comply with the very important holding period rule that is essential for trading success. This helps to control our ego and our greed that can get in the way of profitability.
Another important feature of this trade was that this overall setup and breakout was forecast several weeks ago in September using the tools of Candlestick Patterns in the Manual. As you will see from the video below, the formation of this Pennant and the breakout were expected based on several key Technical Factors that control the movements on the Forex Market.
With this Methodology, you can not only predict major market patterns ahead of other traders, but also confidently trade them when the right setup is eventually provided.
附件:

Trade Less, Earn More
会员从Nov 19, 2014开始
157帖子
Dec 04, 2015 at 11:24
(已编辑 Dec 04, 2015 at 11:51)
Hey guys,
These reversals following ECB decision highlight accuracy of the Profit & Exit Strategies of this Methodology...
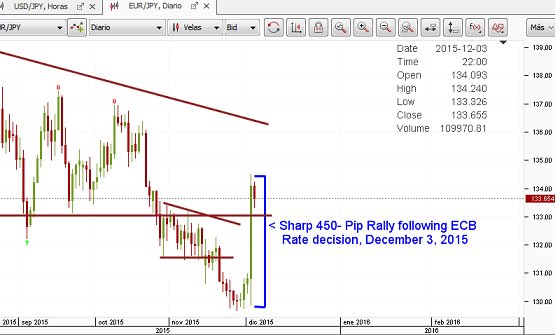

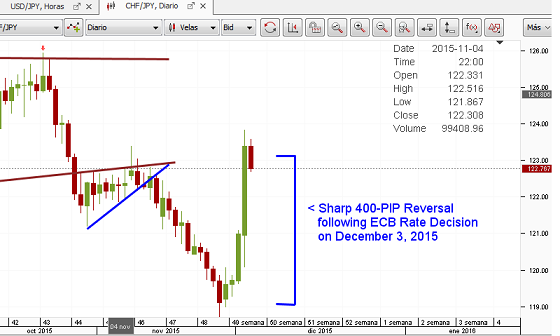
For both Accurate Entries...
and Accurate Exits...
Seem to be worth using...
Duane
DRFXSWINGTRADING
These reversals following ECB decision highlight accuracy of the Profit & Exit Strategies of this Methodology...
For both Accurate Entries...
and Accurate Exits...
Seem to be worth using...
Duane
DRFXSWINGTRADING
附件:
Trade Less, Earn More
会员从Nov 19, 2014开始
157帖子
Dec 04, 2015 at 11:56
For both Accurate Entries...
and Accurate Exits...
Candlestick Patterns and Signals are your best bet.
With these tools, you can spot the end of a Breakout well ahead of trend reversals while maximizing on your gains.
This avoids the dilemma of watching your trades and wondering when to exit based solely on how many Pips you want.
Duane
DRFXSWINGTRADING
Trade Less, Earn More

会员从Oct 02, 2014开始
905帖子
Dec 06, 2015 at 13:06
Good info and charting!
Positivity
会员从Nov 19, 2014开始
157帖子
Dec 06, 2015 at 17:42
(已编辑 Dec 06, 2015 at 17:59)
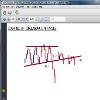
Higher Time Frames make you understand the larger picture of what is happening on the LTFs.
Take the recent spike in the CHF JPY on Thursday.
It may have seemed like a simple trend change with breaks of Downtrend Lines taking place on the 30 Minute Chart....
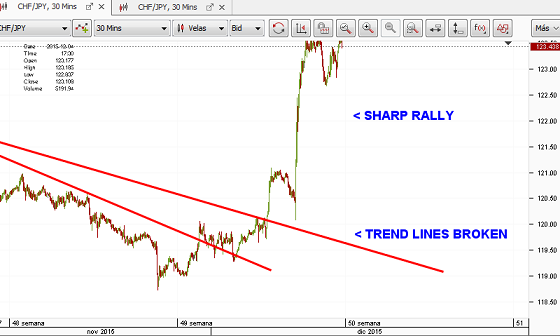
....but examining the Daily Chart, you can see a Large Consolidation being formed ..
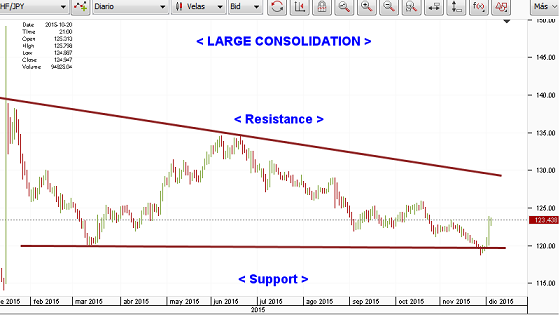
...which is based on certain patterns of candles that generally lead to these Consolidations...
This means that the rally was always gonna to take place to form Support and most persons who saw this would have stopped selling in anticipation of this rally...
Duane
DRFXSWINGTRADING
Take the recent spike in the CHF JPY on Thursday.
It may have seemed like a simple trend change with breaks of Downtrend Lines taking place on the 30 Minute Chart....
....but examining the Daily Chart, you can see a Large Consolidation being formed ..
...which is based on certain patterns of candles that generally lead to these Consolidations...
This means that the rally was always gonna to take place to form Support and most persons who saw this would have stopped selling in anticipation of this rally...
Duane
DRFXSWINGTRADING
Trade Less, Earn More
会员从Nov 19, 2014开始
157帖子
Dec 12, 2015 at 13:00
(已编辑 Dec 12, 2015 at 13:09)
Hey all,
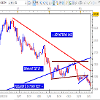
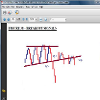
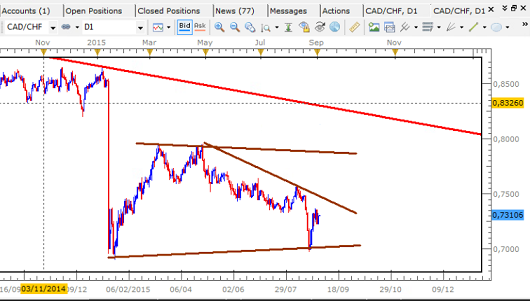
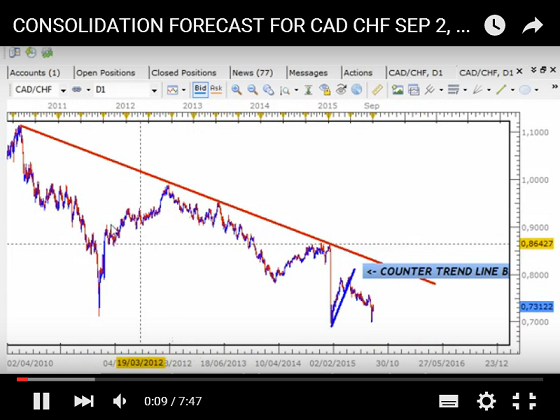
Highlighting another example of the power of the Larger Time Frames and Candlestick Patterns. This week, the CAD CHF decline completed the formation of the Consolidations setup that was predicted.....3 Months Ago...
In September this year, this was the forecast Pennant Consolidation on the Daily Chart. This was based on the types of Candlestick waves that had already taken place...
/DEC_2_2015_CAD_CHF_ACTUAL_PENNANT.png" target="_blank" rel="noopener noreferrer nofollow"> /DEC_2_2015_CAD_CHF_ACTUAL_PENNANT.png"/>

Highlighting another example of the power of the Larger Time Frames and Candlestick Patterns. This week, the CAD CHF decline completed the formation of the Consolidations setup that was predicted.....3 Months Ago...
In September this year, this was the forecast Pennant Consolidation on the Daily Chart. This was based on the types of Candlestick waves that had already taken place...
/DEC_2_2015_CAD_CHF_ACTUAL_PENNANT.png" target="_blank" rel="noopener noreferrer nofollow">
附件:
Trade Less, Earn More
会员从Nov 19, 2014开始
157帖子
Dec 15, 2015 at 23:28
(已编辑 Dec 15, 2015 at 23:29)
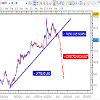
GBP CAD 140 PIPS, FALSE BREAKOUT REVERSAL
The graph below shows one of the examples of False Breakouts that take place across the Forex.
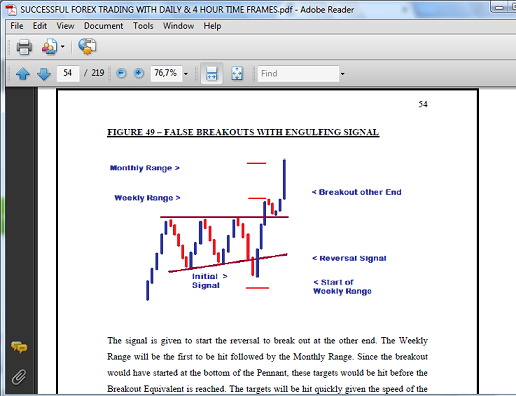
As you can see from the Daily Chart of the GBP CAD below, the setup was almost exactly the same as the one above.
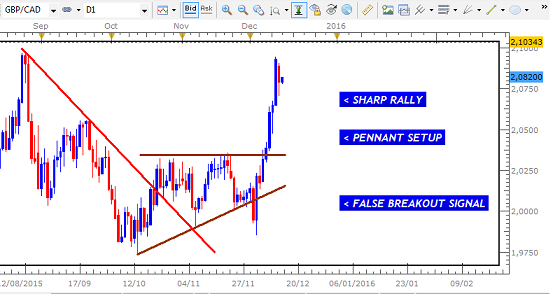
(FXCM Used for Chart Signals based on New York Close of Daily Candle)
Trade was made, led to 140 Pips, using 4H Chart...
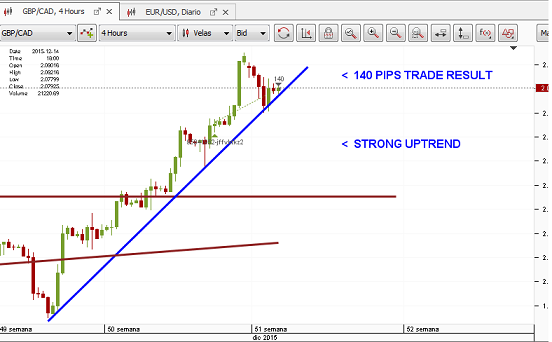
(Dukascopy, where I have my Live Account, used for Trade Execution)
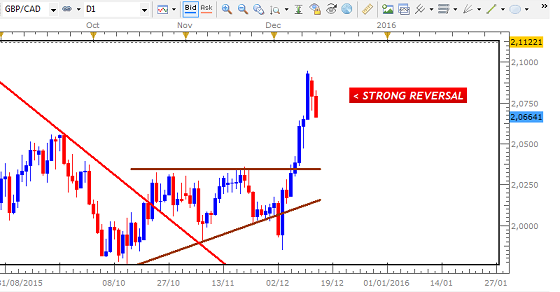
Exit took place ahead of sharp reversal
Maiin Factors
- False Breakouts
- Daily Candle Signals
- Entry using 4 H Chart
Duane
DRFXSWINGTRADING

The graph below shows one of the examples of False Breakouts that take place across the Forex.
As you can see from the Daily Chart of the GBP CAD below, the setup was almost exactly the same as the one above.
(FXCM Used for Chart Signals based on New York Close of Daily Candle)
Trade was made, led to 140 Pips, using 4H Chart...
(Dukascopy, where I have my Live Account, used for Trade Execution)
Exit took place ahead of sharp reversal
Maiin Factors
- False Breakouts
- Daily Candle Signals
- Entry using 4 H Chart
Duane
DRFXSWINGTRADING
附件:
Trade Less, Earn More
会员从Nov 19, 2014开始
157帖子
Dec 22, 2015 at 16:09
GBP USD - TRADE UPDATE
Overall looking Bearish given the Consolidation breakouts on the Daily Chart
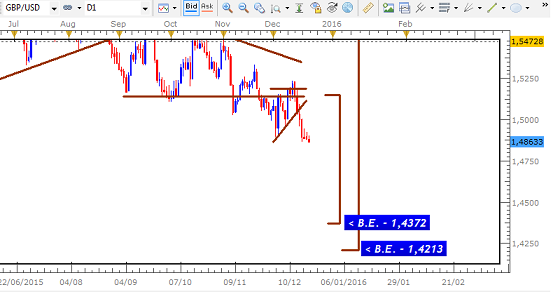
However, 4H Signal given is too weak to trade now...
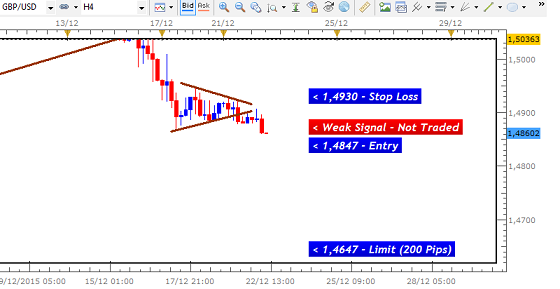
This means we gonna have to wait for another 4H or Daily Signal that is stronger to justify entry
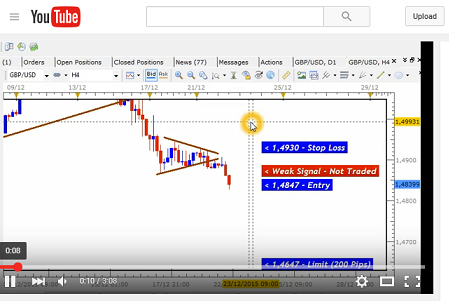
&feature=youtu.be
Duane
DRFXSWINGTRADING
Overall looking Bearish given the Consolidation breakouts on the Daily Chart
However, 4H Signal given is too weak to trade now...
This means we gonna have to wait for another 4H or Daily Signal that is stronger to justify entry
&feature=youtu.be
Duane
DRFXSWINGTRADING
Trade Less, Earn More
会员从Nov 19, 2014开始
157帖子
Dec 28, 2015 at 16:43
Continued in new thread
http://www.myfxbook.com/community/experienced-traders/aggressive-swing-trading-system/1083391,1
Duane
DRFXSWINGTRADING
http://www.myfxbook.com/community/experienced-traders/aggressive-swing-trading-system/1083391,1
Duane
DRFXSWINGTRADING
Trade Less, Earn More
会员从Nov 19, 2014开始
157帖子
Jan 08, 2016 at 18:34
Hello all,
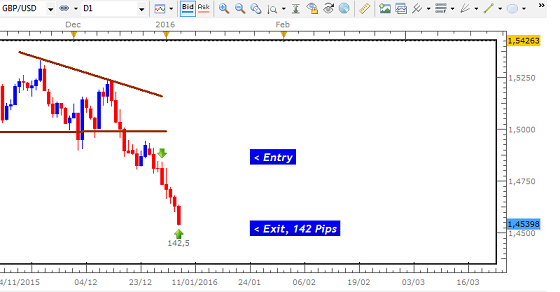
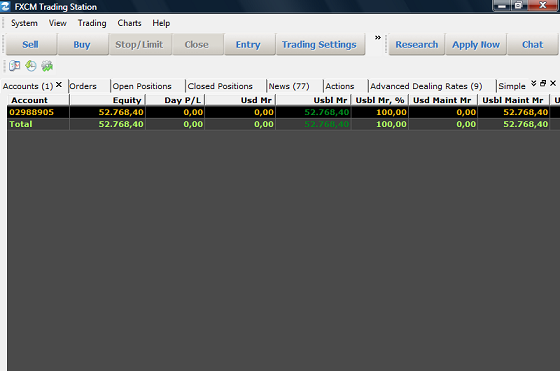
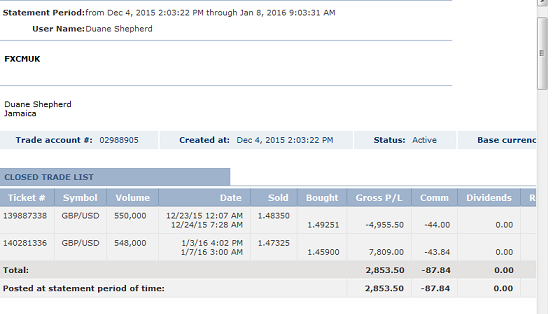
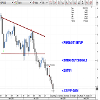
Latest trade was made on the GBP USD
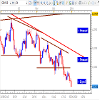
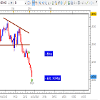
This was a breakout from one of the Consolidation Setups on the Daily Chart
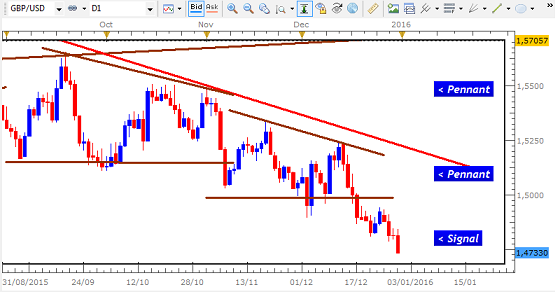
After a few days, target was hit.
This trade was one of the 5 Aggressive Swing Strategies I now use. As it stands, after 2 trades,
Target is to reach $100,000 within 5 trades in the next few weeks, targeting 100- 200 Pips per trade.
Latest trade was made on the GBP USD
This was a breakout from one of the Consolidation Setups on the Daily Chart
After a few days, target was hit.
This trade was one of the 5 Aggressive Swing Strategies I now use. As it stands, after 2 trades,
Target is to reach $100,000 within 5 trades in the next few weeks, targeting 100- 200 Pips per trade.
附件:
Trade Less, Earn More
会员从Nov 19, 2014开始
157帖子
Jan 08, 2016 at 18:34
This is the Video Analysis that led trade above.
&feature=youtu.be
Trade Less, Earn More
会员从Oct 02, 2014开始
905帖子
Jan 09, 2016 at 14:45
Thank you for sharing.
Positivity
会员从Nov 19, 2014开始
157帖子
Jan 10, 2016 at 15:15
No problem...more to come..
Trade Less, Earn More
会员从Nov 19, 2014开始
157帖子
Jan 11, 2016 at 08:09
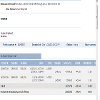
This is the System that is now tracking these 5 Strategies.
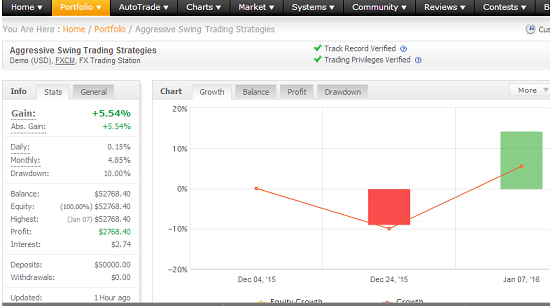
https://www.myfxbook.com/members/DRFXTRADING/aggressive-swing-trading-strategies/1474786
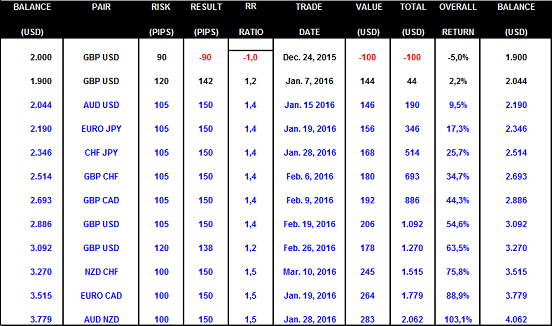
MAIN ASPECTS OF THE STRATEGIES
- Swing Trading using the Daily & 4 Hour Time Frames
- Using Candlestick Signals & Patterns for Entry Decisions
- Targeting High Probability Trades that provide 100 - 200 Pips Each
- Using Leverage of 100:1
- Stop Losses of 90 Pips (4H Chart) & 120 Pips (Daily)
- The Projections in the Tables assume an average Risk of 105 Pips and Average Gains of 150 Pips
Starting with the last two trades, the target is to hit 100% within a few trades, using 10% Risk Per Trade.
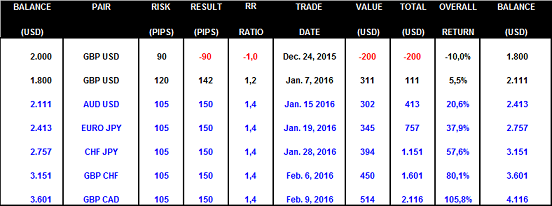
At a 5% Risk Per Trade, this 100% would be hit with only a few more trades.
With these strategies, a larger rate of turnover can be achieved than the more conservative strategy that was also successful..
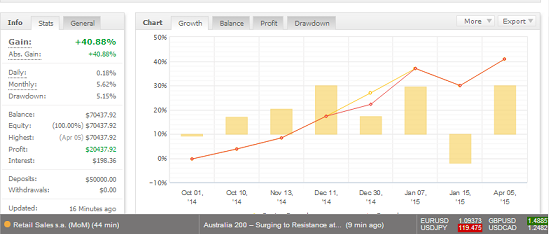
https://www.myfxbook.com/members/DRFXTRADING/swing-trading-part-1/1079693
Questions about the strategies and results are welcomed. All the results will be explained with Videos.
Duane
DRFXSWINGTRADING


https://www.myfxbook.com/members/DRFXTRADING/aggressive-swing-trading-strategies/1474786
MAIN ASPECTS OF THE STRATEGIES
- Swing Trading using the Daily & 4 Hour Time Frames
- Using Candlestick Signals & Patterns for Entry Decisions
- Targeting High Probability Trades that provide 100 - 200 Pips Each
- Using Leverage of 100:1
- Stop Losses of 90 Pips (4H Chart) & 120 Pips (Daily)
- The Projections in the Tables assume an average Risk of 105 Pips and Average Gains of 150 Pips
Starting with the last two trades, the target is to hit 100% within a few trades, using 10% Risk Per Trade.
At a 5% Risk Per Trade, this 100% would be hit with only a few more trades.
With these strategies, a larger rate of turnover can be achieved than the more conservative strategy that was also successful..
https://www.myfxbook.com/members/DRFXTRADING/swing-trading-part-1/1079693
Questions about the strategies and results are welcomed. All the results will be explained with Videos.
Duane
DRFXSWINGTRADING
附件:
Trade Less, Earn More


