


Gold posts new 6-month high


· Gold surges in short-term
· Stochastic stands in overbought area, indicating bearish correction
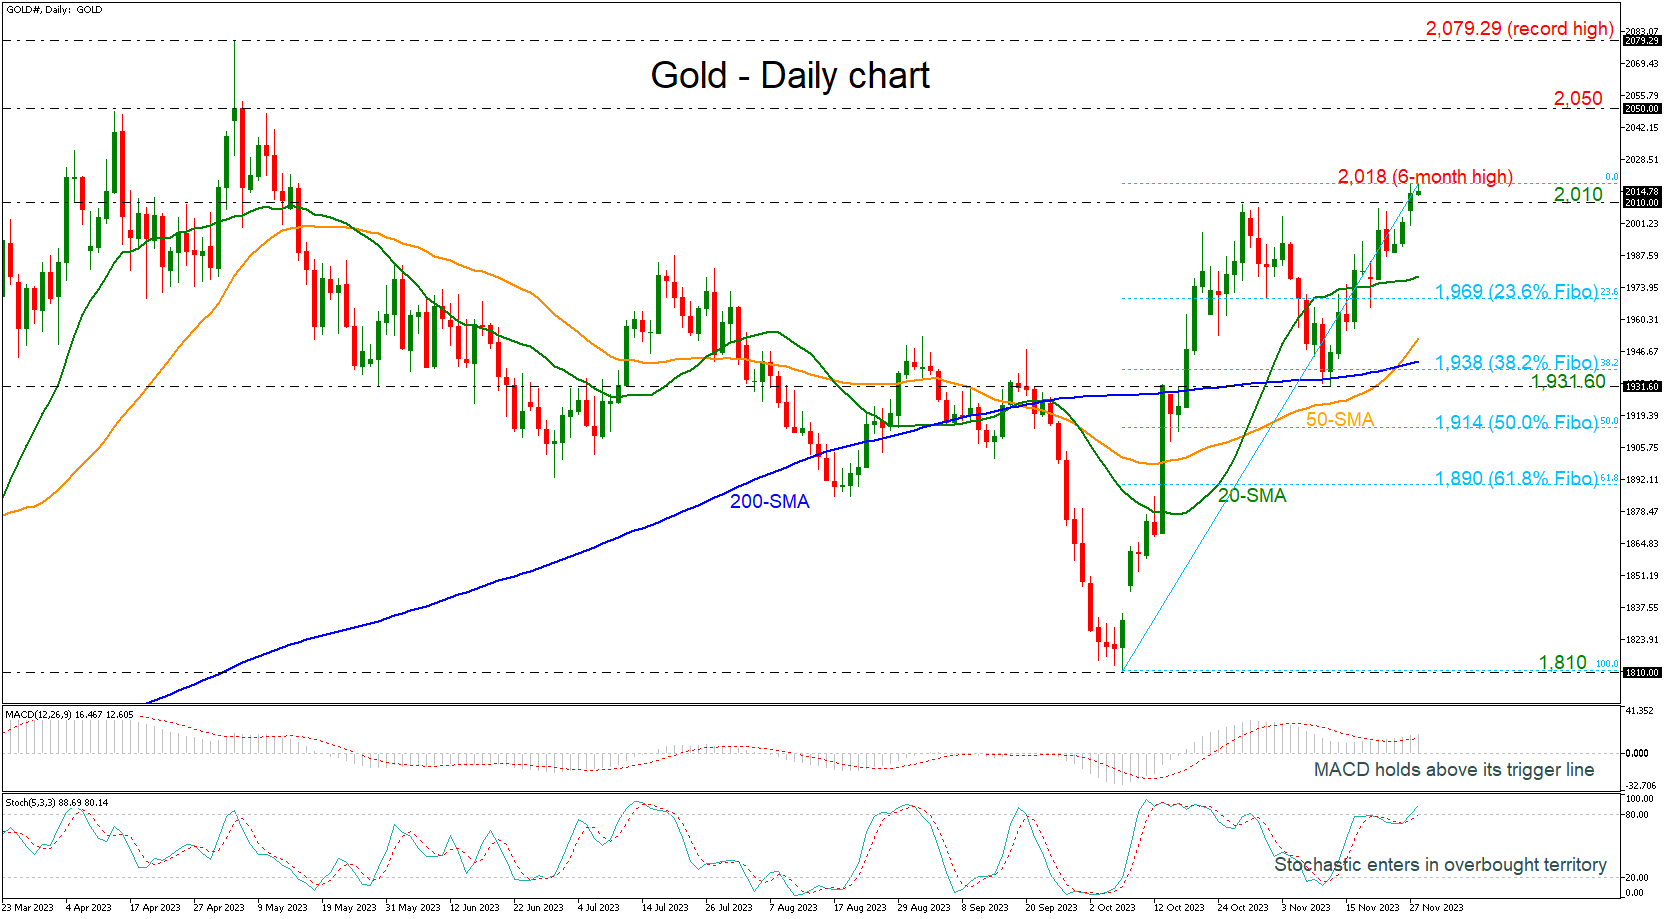
Gold prices are extending their bullish rally towards a fresh six-month high of 2,018, holding well above the simple moving averages (SMAs) in the daily timeframe.
Technically, the MACD oscillator is strengthening its bullish structure above its trigger and zero lines; however, the stochastic oscillator is showing overbought conditions as it is holding above the 80 level, so a bearish correction may be a possible scenario for the next few sessions.
If the market continues to the upside, then it may target the 2,050 resistance level ahead of the record high of 2,079.29, achieved on May 4.
On the other hand, if the bears take control, the yellow metal could move towards the 20-day SMA at 1,978 and the 23.6% Fibonacci retracement level of the upward wave from 1,810 to 2,018 at 1,969. Underneath these lines, the 50- and the 200-day SMAs at 1,952 and 1,942, respectively could come in focus before meeting the 38.2% Fibonacci of 1,938.
All in all, gold is looking strongly bullish in the short-term so the worries may rise for a bearish retracement, according to the stochastic oscillator, before heading higher again.
.jpg "Gold posts new 6-month high")

Dollar Slips, Gold Softens as Shutdown Drags On | 6th November 2025

Markets buoyed by US data; equities rebound, dollar slips

EBC Markets Briefing | Euro rebounds; clean energy has shined in 2025

The pound fears the Bank of England
 Analysis: Is a Price Squeeze Signaling Volatility Ahead?")
Gold (XAUUSD) Analysis: Is a Price Squeeze Signaling Volatility Ahead?

Crypto bulls fail to maintain momentum

Crypto bulls fail to maintain momentum


