





Nasdaq100: not yet a correction

The Nasdaq100 index was once again the main driver of growth in US indices in May, indirectly also positively influencing markets elsewhere. On Thursday, the index was approaching the 19,000 level, adding over 11% to the 19 April lows. An impressive wave of selloffs hit the market, taking 2% off the index from peak to bottom. And now, the legitimate question is, are we seeing the beginning of a long correction?
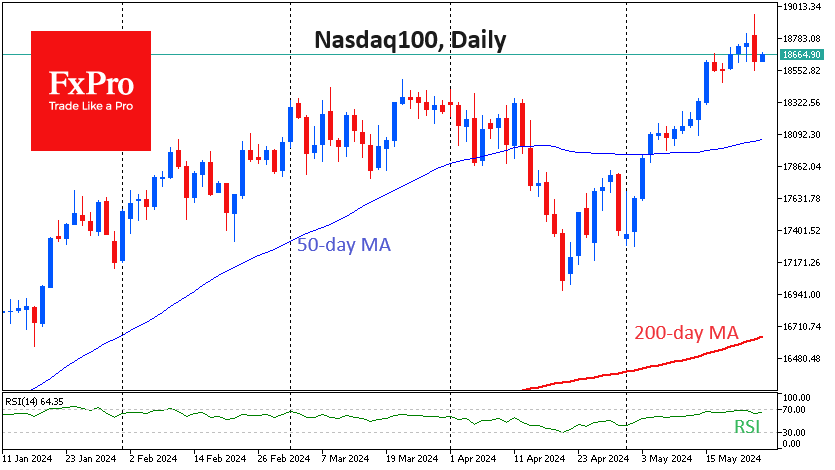
Technically, the Nasdaq100 index is at the threshold of the overbought zone on RSI on daily timeframes. Contrary to the name, entering this area is more likely to see the most intense growth, although the least unpredictable. Buyers' interest is supported by the fact that the index is now only 1% above the previous peak. After that peak, there was already an April correction that removed much of the market's short-term overheating.
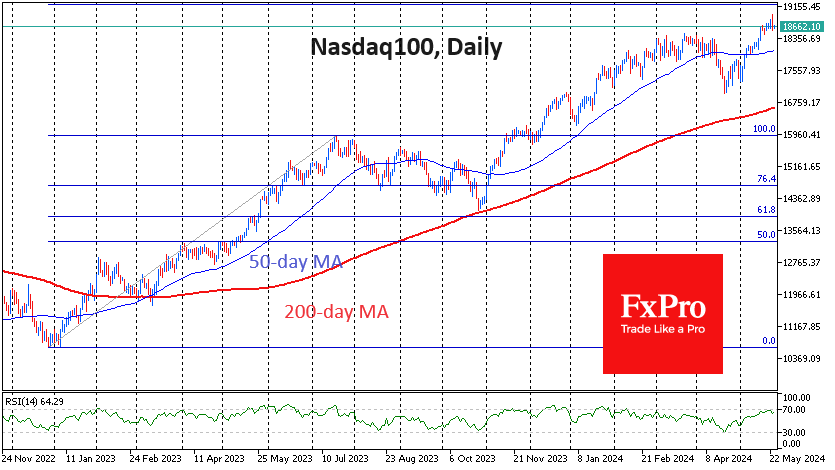
The correction in July-October last year fits into a classic Fibonacci pattern, bringing the Nasdaq100 index close to 61.8% of the original rally and one hair away from the 200-day moving average. This should classically be followed by a rally to 161.8%, around 19200.
So, the Nasdaq100 is a little short of an important resistance area. But it is quite possible that it simply pauses to consolidate forces before a new leap upwards.
However, without a dramatic change in sentiment or a dramatic deterioration of economic data, we should not expect a steady decline in equity indices. The last downward impulse was short-term profit-taking provoked by a new batch of strong macroeconomic data. They suggest tighter monetary policy, but that is not a sufficient reason to start a bear market in equities.
Still, it is worth noting that a drop below the previous consolidation at the top near 18300 could be an important technical signal of a trend reversal.
By the FxPro Analyst Team


The S&P 500 is churning under the surface

Weekly Technical Outlook – USD/JPY, EUR/USD, GOLD

Weekly Technical Outlook – USDJPY, EURUSD, GOLD

The dollar is propping up the yen

The crypto market is moving in the opposite direction to equities

Forex and Crypto Forecast: August 3–7, 2026

Oil slumps on Iran deal hopes, yen surges, chips wobble again