


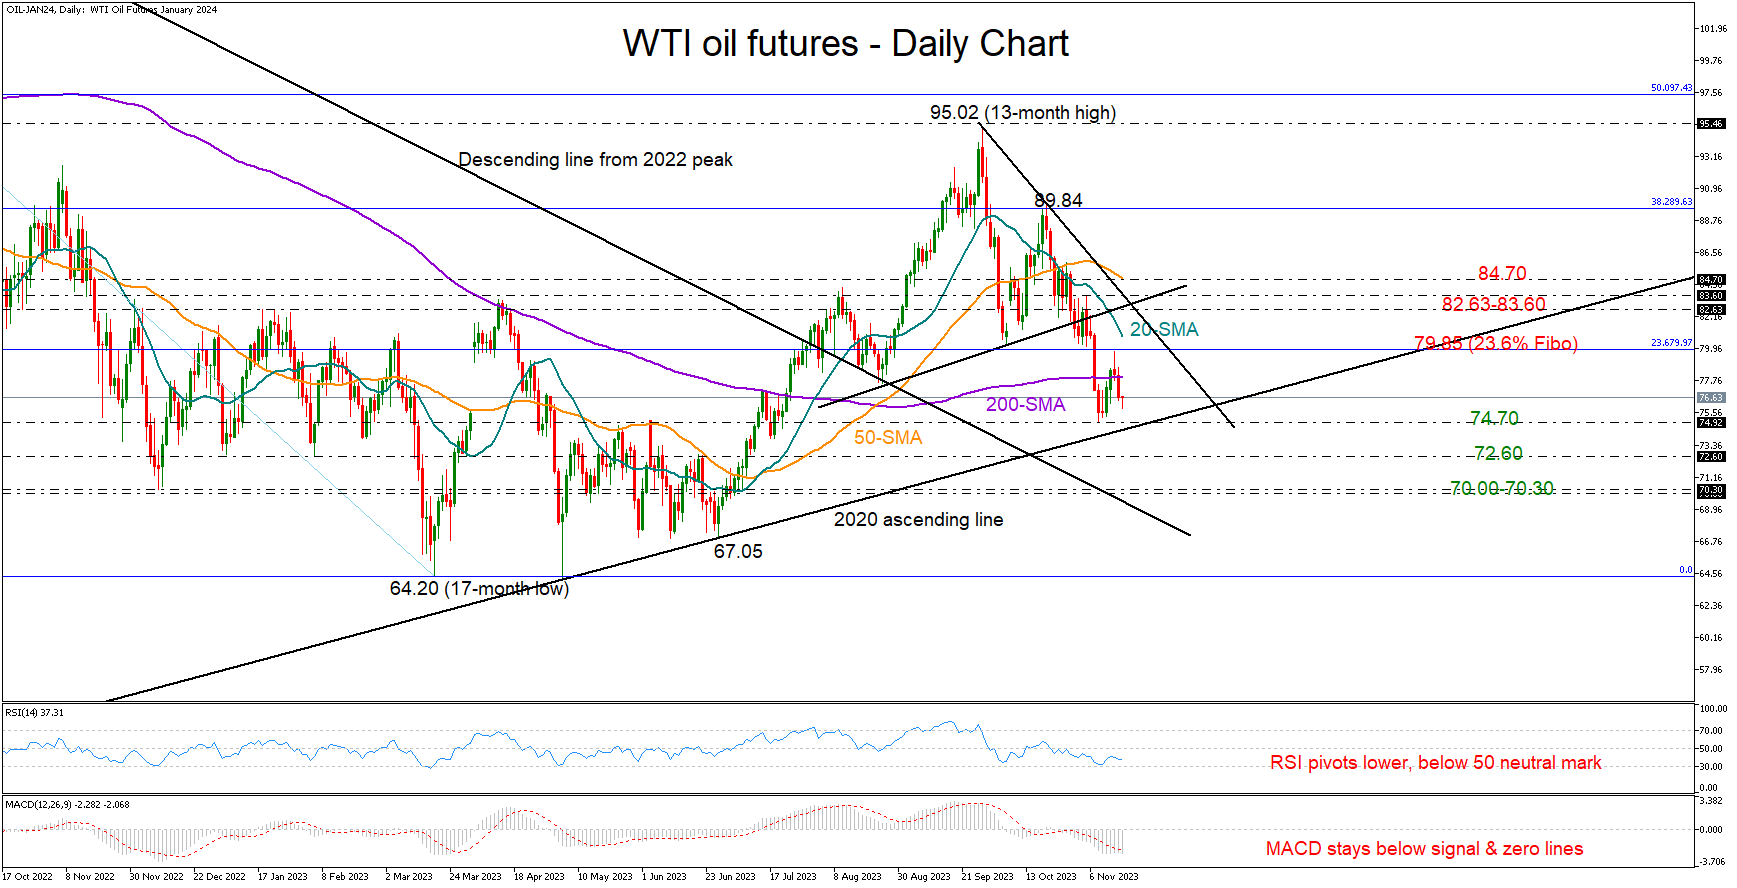
WTI oil turns down, but 2020 trendline feeds hopes


WTI oil futures reversed their post-CPI increase above the 200-day SMA, dropping immediately after reaching a high of 79.77 on Tuesday.
The RSI and the MACD have resumed their negative slope in the bearish area, signaling more depressing sessions ahead. But the upcoming sessions might be quite interesting as the long-term support trendline, which connects the 2020 and 2023 lows, is within breathing distance at 74.70 and could still act as a safety net.
A step below that ascending trendline would dampen market sentiment, likely causing a quick downfall to 72.60. Should selling forces persist, the price could meet its 2022 trough within the 70.00-70.30 zone, while lower, the descending line drawn from March 2022 could come to the rescue at 69.00.
If buying appetite boosts the price above its 200-day SMA, the focus will turn again to this week’s high of 79.77, where the 23.6% Fibonacci retracement of the 2022-2023 downtrend is positioned. The 20-day SMA will be closely watched as well at 80.80 given its limitations in October, while the 82.60-83.60 territory could be another hurdle ahead of the 50-day SMA.
Summing up, despite the negative technical indicators, there is a chance for WTI oil futures to rotate higher when they reach the 2020 upward-sloping line at 74.70.
.jpg "WTI oil turns down, but 2020 trendline feeds hopes")

Markets buoyed by US data; equities rebound, dollar slips

EBC Markets Briefing | Euro rebounds; clean energy has shined in 2025

The pound fears the Bank of England
 Analysis: Is a Price Squeeze Signaling Volatility Ahead?")
Gold (XAUUSD) Analysis: Is a Price Squeeze Signaling Volatility Ahead?

Crypto bulls fail to maintain momentum

Crypto bulls fail to maintain momentum

GBP/USD Hovers Near Lows as Bank of England Decision Looms


