Advertisement

ImperivmFx
Joined
Jun 10, 2015
Connections:
0
Erfahrung:
Mehr als fünf Jahre
Standort:
Italy
Profil
Bio
I study and follow actively markets about from the year 2000.
I'm graduated in history with a specialization in economy and war.
I have a master's degree in geopolitics and I wrote a thesis on the modern currency war (2015).
I developed several strategies and EAs that are constantly updated according to market conditions and the ongoing studies.
My main strategy defines and works on short term trends and overbougt/oversold conditions.
Most of my trades are automated and technical, but sometimes I perform manual operations on trends resulting from fundamental analysis (but always when precise techinical criteria are met).
Handelsstil
High (calculated) Risk/High Reward.
Motto
Trading is a WarGame
Systems by ImperivmFx
Aktuelle Beiträge
ImperivmFx's Reviews
Charts-Aktivität
-
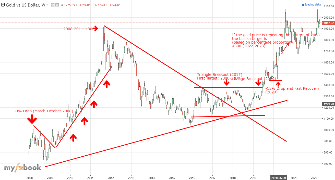
XAUUSD,W1 nach ImperivmFx Apr 22, 2020 at 16:52