


Is the Gold Bull Done Charging? Year End Checkpoint


As of November 2025, the metal trades near $4,000 per troy ounce, up about 46% year to date, cementing one of the standout stories of the year. The surge caps a record‑breaking run that saw prices briefly top $4,300 in October as investors confronted a tangle of macro pressures and geopolitical strains.
By historical standards, the showing is extraordinary. Over the last 25 years, gold has returned roughly 10.9% annually on average, supporting its reputation as a hedge against inflation and market shocks. Yet 2025’s rally has outpaced even those expectations, prompting sharper questions about the forces behind demand and whether gold’s safe‑haven status has entered a new phase. Because of this, many investors are now asking whether gold price is a good investment in today’s volatile market.
In a landscape riddled with uncertainty, gold’s comeback serves as both a gauge of investor unease and a reminder of why this ancient store of value retains a prominent place in modern portfolios. Grasping the drivers of this move and what they say about the wider economy has rarely been more important for investors navigating today’s volatility.
What Could Move Gold Prices Over the Next 3 Months
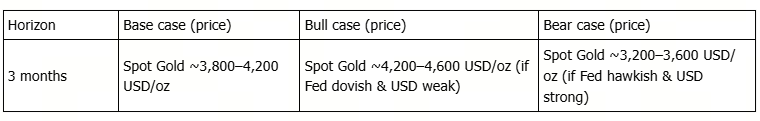
Gold’s trajectory from November 2025 to February 2026 will likely be driven by a mix of interrelated factors:
Demand from Central Bank
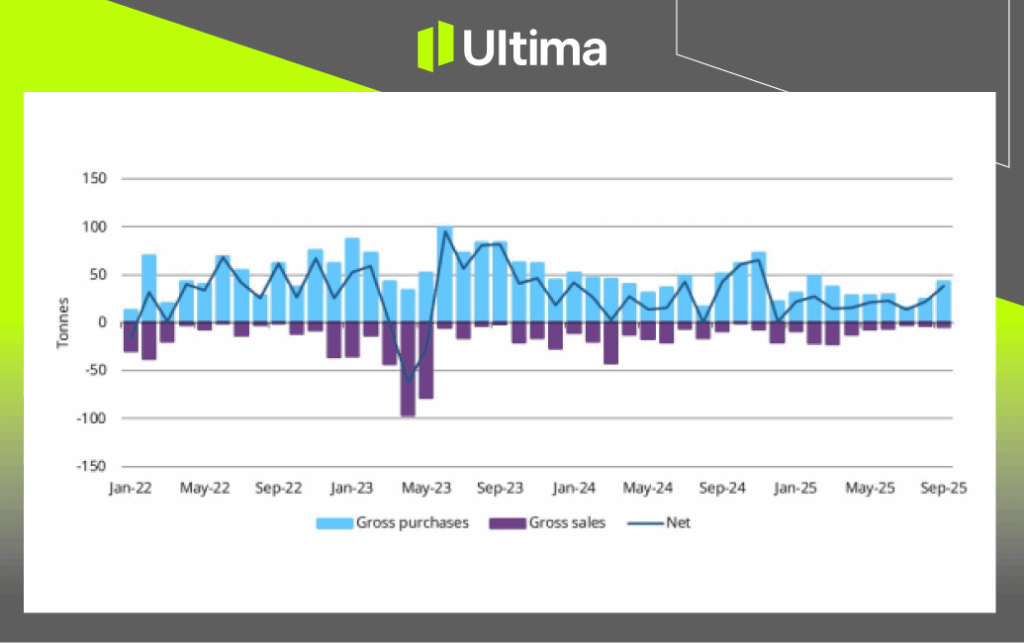
Central banks worldwide are still buying gold aggressively, creating what many see as a firm floor under prices. Current industry estimates point to roughly 900 tonnes of net central-bank purchases in 2025, driven by a faster push to diversify away from US dollar reserves. This structural bid is expected to persist into 2026, helping support prices during bouts of economic stress.
The institutional demand was especially clear in September, when official data (IMF and other sources) showed net central-bank buying of 39 tonnes, up 79% month over month and the highest monthly tally of 2025. Over the first nine months of the year, net additions reached 200 tonnes, highlighting the durability of this buying trend.
World Gold Council: Central Bank Gold Data for September 2025
Geopolitical Stressors and Macro Headwinds
Ongoing strains, such as the US–China trade frictions and wider policy uncertainty, continue to boost gold’s safe-haven appeal. Risks of stagflation, possible recessions, and shifts in US policy (like new tariffs) are broadly supportive, while firm inflation and a softer dollar could add another tailwind for demand.
Interest Rate and Policy Outlook
Expected Fed rate cuts (possibly one more in 2025) would lower yields, improving the appeal of non‑interest‑bearing assets like gold. That said, a brighter outlook on US–China trade talks could briefly dampen safe‑haven demand.
Investor Behaviour and ETF Inflows/Outflows
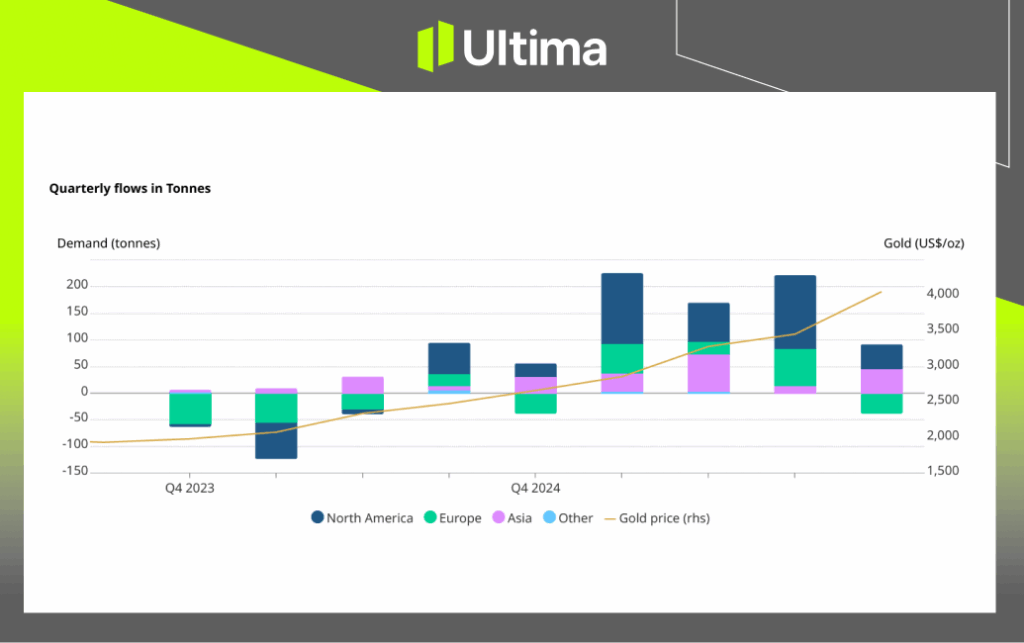
Global physically backed gold ETFs saw a fifth straight month of inflows in October, totalling US$8.2 billion. While slower than September, the pace still topped the year-to-date monthly average of US$7.1 billion, putting ETFs on track for a record year with two months to go.
North America and Asia led October’s inflows, whereas Europe posted outflows. By month-end, global gold ETF AUM rose 6% month-over-month to US$503 billion, with holdings up 1% month-over-month to 3,893 tonnes.
World Gold Council: Gold ETF Flows by Region
Supply Constraints
A lack of significant new mining developments and consistent recycling output (approximately 344 tonnes in Q3 2025) continue to restrict supply. This tightening market could lend upward pressure to prices amid sustained and growing demand.
Investment Outlook
Gold’s enduring role as a hedge against inflation, currency debasement, and economic uncertainty supports a broadly bullish long-term view, particularly for diversified portfolios. Still, short-term pullbacks may occur due to technical overextension, creating potential buying opportunities near the $3,500–$3,800 range.
Overall, structural demand remains the dominant driver, outweighing near-term risks. Traders may seek upside exposure while managing volatility with protective stops. For safer exposure, investors might consider GLD or physical gold, maintaining moderate position sizes. A prudent stop-loss level would be near the 50-day moving average, around $354–$355 for GLD.
Conclusion
As gold continues to shine amid economic and geopolitical uncertainty, understanding its market dynamics is key for traders and investors alike. Stay informed and seize potential opportunities in commodities trading with Ultima Markets. To sharpen your trading strategies and gain deeper insights into global market trends, visit UM Academy for expert analysis and educational resources.
Disclaimer
Comments, news, research, analysis, price, and all information contained in the article only serve as general information for readers and do not suggest any advice. Ultima Markets has taken reasonable measures to provide up-to-date information, but cannot guarantee accuracy, and may modify without notice. Ultima Markets will not be responsible for any loss incurred due to the application of the information provided.


Investors cheer potential end to US government shutdown

The dollar plays on bets

Gold Climbs to Two-Week High

Good news for Crypto bargain hunters

Good news for Crypto bargain hunters

EBC Markets Briefing | Yen lower on weak data; market frowns at Musk's pay package

How FCA Regulation Matters for Traders


