Waterfall Chart投票結果

您喜歡這個建議嗎?

沒有

Waterfall Chart討論

May 18, 2012 at 15:27
512流覽
1 Replies
會員從Apr 22, 2012開始   2帖子
May 18, 2012 at 15:27 (已編輯May 18, 2012 at 15:08)
if you click on a symbol (like USD/EUR) then you get the normal candelstick chart.
My suggestion is:
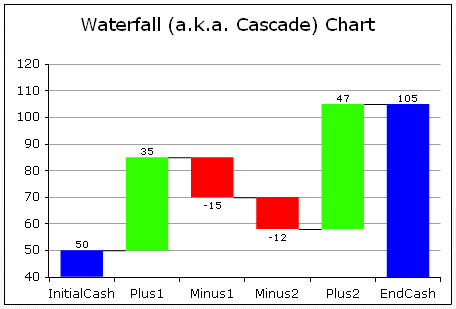
If you click on a symbol in the categorie 'history' you will see a waterfall chart, like:

h

You will see the history of trading in new reflexion.

br sigmaly
會員從Apr 22, 2012開始   2帖子
May 18, 2012 at 18:06
登錄 / 註冊 to comment
You must be connected to Myfxbook in order to leave a comment
*商業用途和垃圾郵件將不被容忍,並可能導致帳戶終止。
提示:發佈圖片/YouTube網址會自動嵌入到您的帖子中!
提示:鍵入@符號,自動完成參與此討論的用戶名。