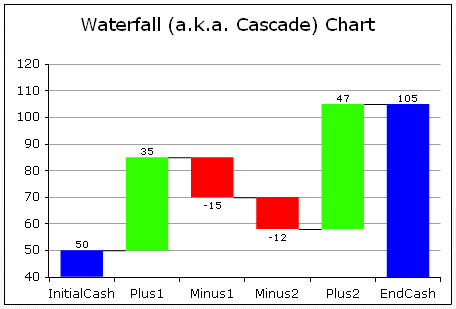
Waterfall Chart वोट के परिणामों
Edit Your Comment
Waterfall Chart चर्चा करें
May 18, 2012 at 15:27
(एडिट हो रहा है May 18, 2012 at 15:08)
तबसे मेंबर है Apr 22, 2012
2 पोस्टों

*व्यवसायिक इस्तेमाल और स्पैम को ब्रदाश नहीं किया जाएगा, और इसका परिणाम खाता को बन्द करना भी हो सकता है.
टिप: किसी चित्र या यूट्यूब या URL को पोस्ट करने से वे अपने आप आपके पोस्ट में आजाएगा!
टिप: @ चिन्ह को टाइप करें उपभोगता के नाम को अपने आप करने के लिए जो इस चर्चा में भाग ले रहा है.


