Waterfall Chart投票結果

この提案が気に入りましたか?

はい いいえ

Waterfall Chart 討論

May 18, 2012 at 15:27
513 視聴
1 Replies
Apr 22, 2012からメンバー   2 投稿
May 18, 2012 at 15:27 (編集済みのMay 18, 2012 at 15:08)
if you click on a symbol (like USD/EUR) then you get the normal candelstick chart.
My suggestion is:
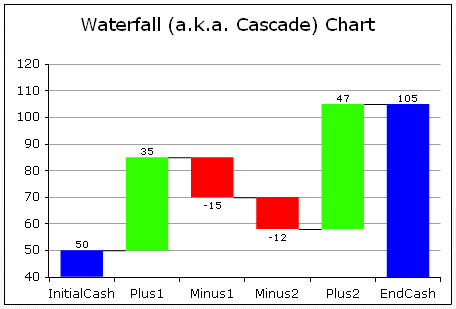
If you click on a symbol in the categorie 'history' you will see a waterfall chart, like:

h

You will see the history of trading in new reflexion.

br sigmaly
Apr 22, 2012からメンバー   2 投稿
May 18, 2012 at 18:06
サインイン / 登録 to comment
You must be connected to Myfxbook in order to leave a comment
*商用利用やスパムは容認されていないので、アカウントが停止される可能性があります。
ヒント:画像/YouTubeのURLを投稿すると自動的に埋め込まれます!
ヒント:この討論に参加しているユーザー名をオートコンプリートするには、@記号を入力します。