GBPUSD flatlines near channel’s upper band

GBP/USD takes a breather after hitting a five-month high. Overbought signals strengthen as price tests key resistance.
XM Group | 57 days ago

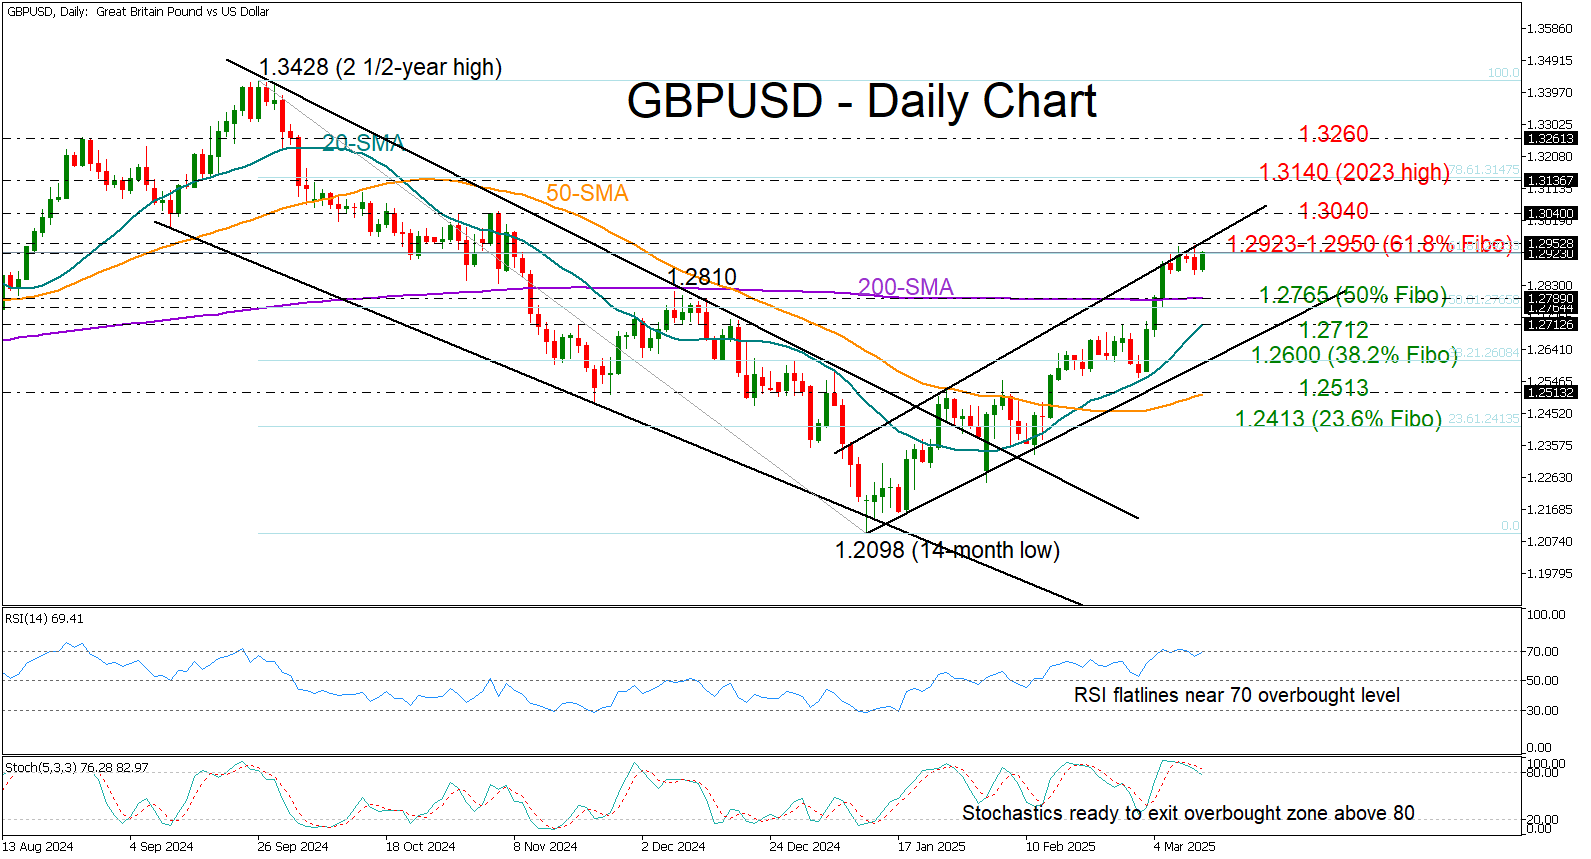
GBP/USD has been treading water around the 1.2923 level, struggling to gain further traction after its March bull run stalled near the upper boundary of its bullish channel.

The pair surged as high as 1.2945 last week, marking its highest level since November 2024. However, strengthening overbought signals suggest the recent rally may be losing steam, as the RSI and the stochastic oscillator seem to have peaked above 30 and 20, respectively.

A decisive breakout above the 1.2923-1.2950 resistance—aligned with the 61.8% Fibonacci retracement of the prior downtrend—could reignite buying interest. If the November peak of 1.3040 is surpassed, momentum could build toward the 2023 high of 1.3140, with the next resistance possibly emerging near 1.3260, a key barrier from August 2024 and March 2022.

On the flip side, if sellers regain control, the pair may retreat toward the 200-day simple moving average (SMA), which hovers just above the 50% Fibonacci level of 1.2765, and the 20-day SMA at 1.2712. Further losses could bring the lower band of the bullish channel into play around the 38.2% Fibonacci level of 1.2600, ahead of the 50-day SMA at 1.2513.

In summary, GBP/USD is at a crucial juncture. A push beyond 1.2950 and out of the bullish channel could inject fresh momentum. Otherwise, the next move could see the pair sliding backwards.  


  Add a Comment

Regulation: CySEC (Cyprus), ASIC (Australia), FSC (Belize), DFSA (UAE), FSCA (South Africa)
read more
Tariffs Ignite Safe-Haven Rally

Tariffs Ignite Safe-Haven Rally

Global financial markets on May 6, 2025, are stabilizing as investors await the Federal Reserve’s two-day FOMC meeting, with major currency pairs trading in tight ranges. Gold and silver rally on safe-haven demand driven by Trump’s new tariff threats and Middle East tensions, while the US Dollar holds steady despite recent weakness.
Moneta Markets | 1 day ago
ATFX Market Outlook 6th May 2025

ATFX Market Outlook 6th May 2025

U.S. ISM Services PMI for April indicated accelerated expansion. However, the input prices index surged to its highest level in over two years, highlighting rising inflationary pressures likely stemming from tariffs. U.S. Treasury yields inched higher, while the dollar weakened against major currencies like the euro and yen as markets assessed the ongoing uncertainty surrounding President Trump’s
ATFX | 1 day ago
USDJPY, GBPUSD, Oil

USDJPY, GBPUSD, Oil

Fed policy meeting to leave rates on hold; Will USDJPY recover ground?; BoC to cut rates by 25bps; GBPUSD ticks up; OPEC+ speeds up increases; WTI opens with bearish gap
XM Group | 2 days ago
ATFX Market Outlook 5th May 2025

ATFX Market Outlook 5th May 2025

Last Friday, the April Nonfarm Payrolls report in the U.S. surpassed expectations, indicating a resilient labor market. However, signs of slowing economic momentum, such as a contraction in Q1 GDP and rising jobless claims, raised concerns about a broader slowdown.
ATFX | 2 days ago
ATFX Market Outlook 2nd May 2025

ATFX Market Outlook 2nd May 2025

Markets rallied overnight on upbeat sentiment. The U.S. Dollar Index extended gains for a third session, reclaiming the 100 mark to close at 100.18, supported by optimism over trade talks and stronger-than-expected ISM manufacturing data. U.S. Treasury yields climbed across the curve, with the 10-year yield at 4.221% and the 2-year at 3.709%. 
ATFX | 5 days ago
ATFX Market Outlook 30th April 2025

ATFX Market Outlook 30th April 2025

On Tuesday, President Trump signed an executive order combining tariff credits and duty exemptions for specific auto parts to mitigate the impact of auto tariffs. U.S. stocks rose sharply, with the Dow Jones up 0.75%, the S&P 500 gaining 0.58%, and the Nasdaq climbing 0.55%. The benchmark 10-year U.S.
ATFX | 7 days ago