


Gold sends negative signals

- Gold slips below symmetrical triangle after US-EU trade deal
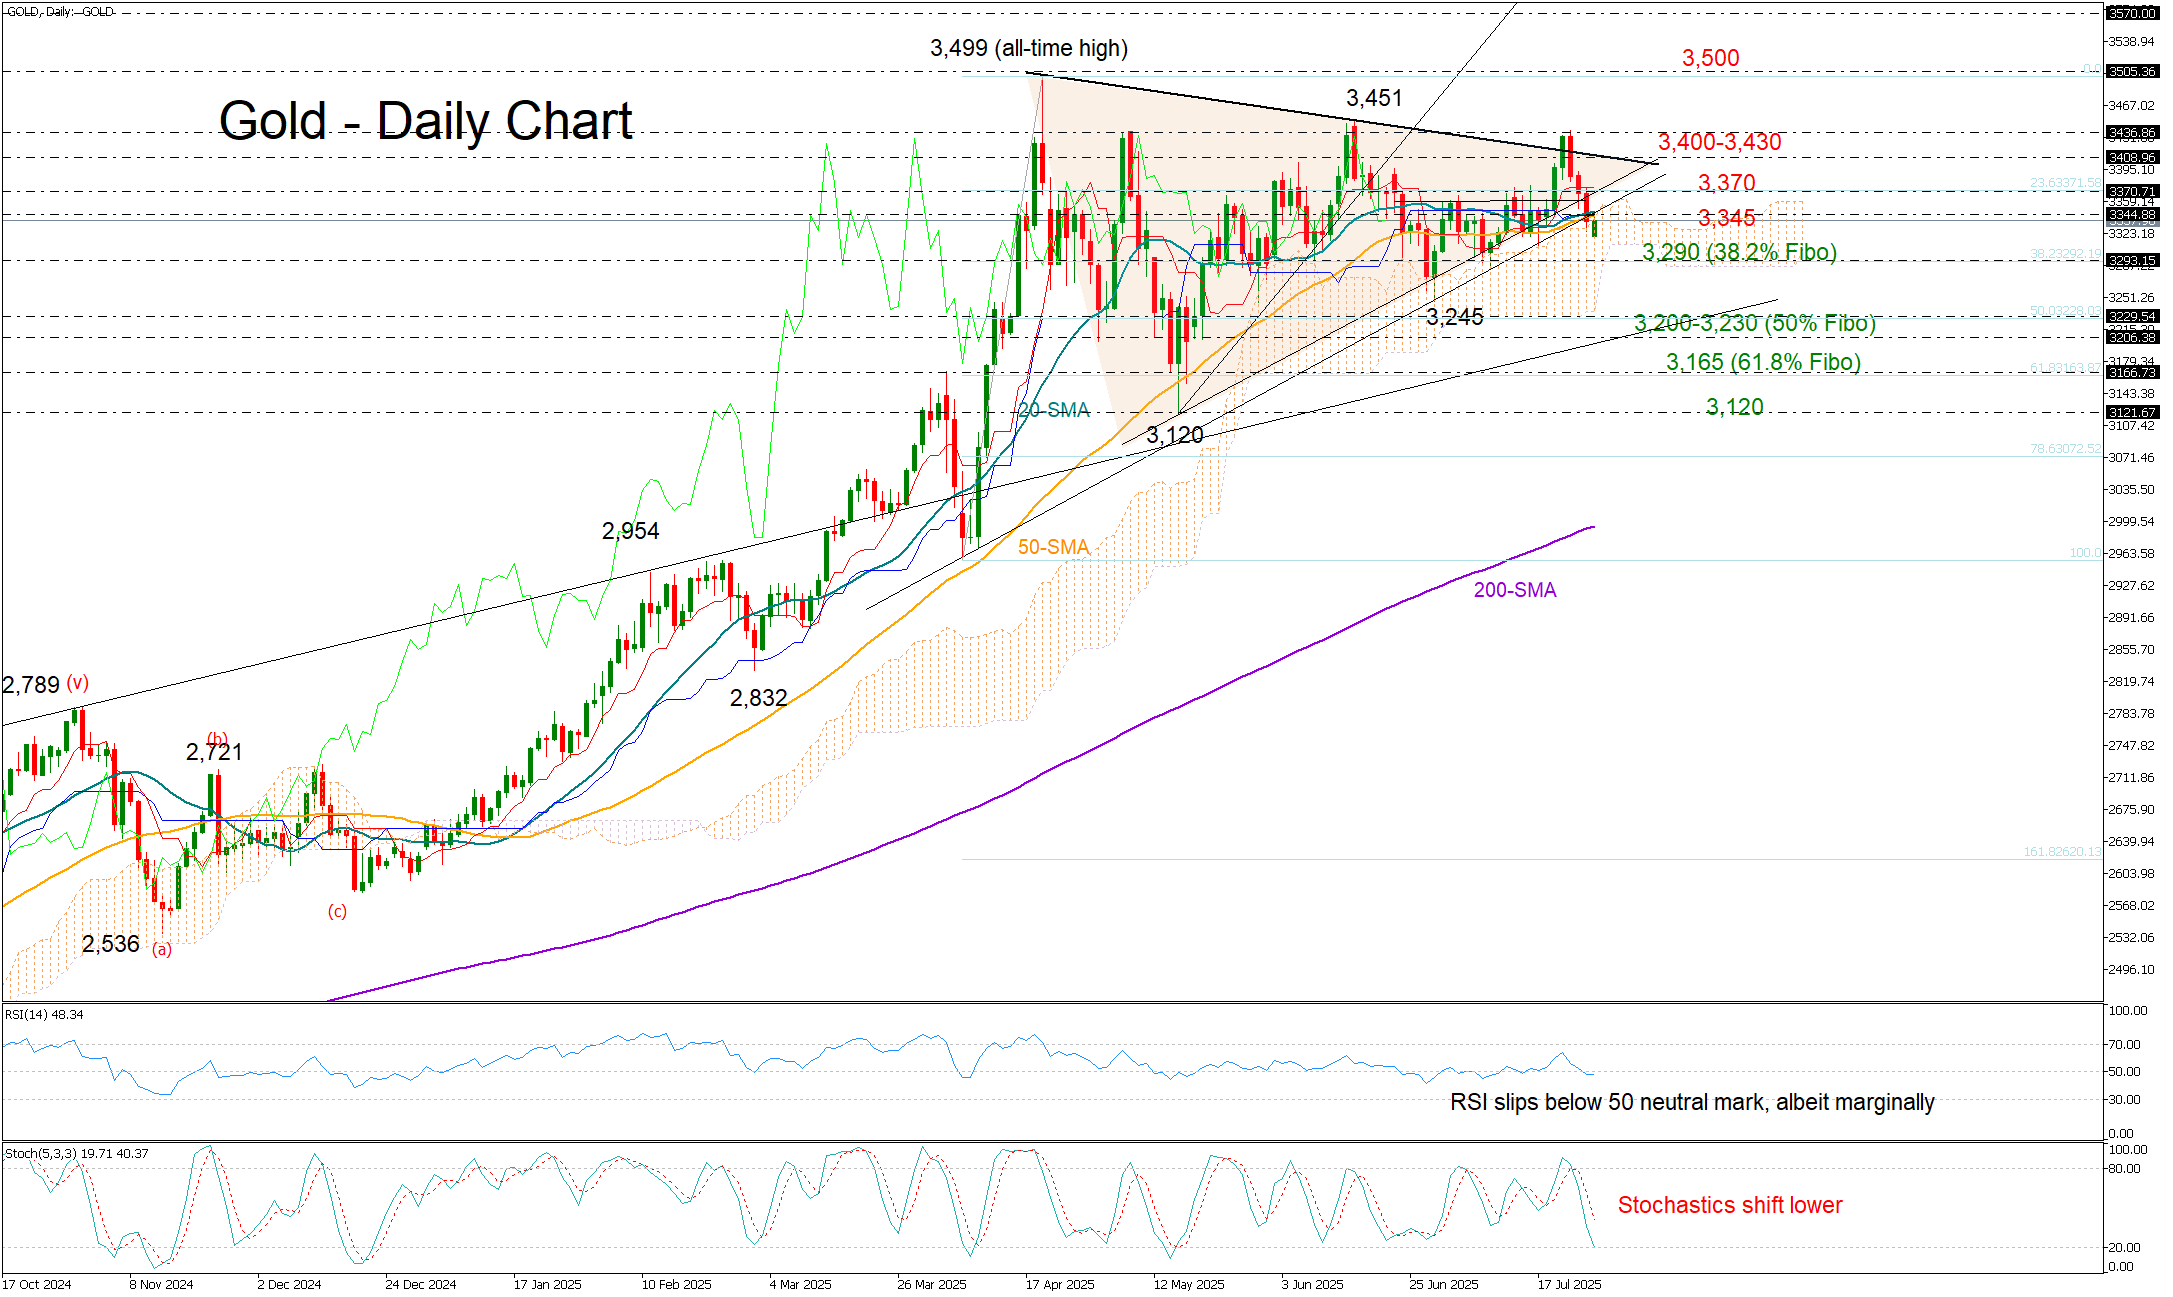
- Technical signals lean bearish; resistance at 3,345
 Gold opened Monday’s session with a gap lower at 3,319, following news over the weekend that the EU has accepted 15% US import tariffs, half of what President Trump had previously threatened.
However, caution soon returned, with the precious metal bouncing back above Friday’s closing price as the benefits of the deal for the EU appeared unclear. Under the agreement, US import tariffs will be applied to EU automobiles, and the bloc is expected to invest heavily in US energy and military equipment without implementing any retaliatory measures. Notably, 50% US tariffs on steel and aluminum will remain in place for now.
From a technical perspective, today’s drop pushed the price below a symmetrical triangle, the short-term simple moving averages, and into the Ichimoku cloud, all of which suggest a potential bearish continuation. With the RSI crossing below its neutral 50 mark and the stochastic oscillator turning south, the risk remains tilted to the downside—especially if the 3,345 area turns into firm resistance.
An extension lower could initially retest the 38.2% Fibonacci retracement of the April upleg, around 3,290. Further declines might be cushioned by the area between the 50% Fibonacci level at 3,230 and the key support zone near 3,200. However, only a break below the 61.8% Fibonacci retracement of 3,165 would officially confirm a bearish trend reversal in the big picture.
On the upside, a move above the 3,345–3,370 range could revive some buying interest. Still, a decisive close above the triangle’s upper boundary near 3,400, and last week’s resistance at 3,430, would likely be needed to trigger a faster rally toward the critical 3,500 mark.
In a nutshell, today’s decline has shifted the bias to the bearish side. If the 3,345 area turns into strong resistance, selling pressure may resurface.


Copper Signals a Potential Turning Point for Commodity Markets

Weekly Recap and Forecast: Gold and Silver Rebound on Weak NFP Numbers. Crude Brent falls to $70 a barrel

The dollar: has the trend been broken?

Soft jobs report pressures dollar, gold surges, stocks mixed

Yen Volatility Heightened by Intervention Risk and Soft US Jobs

NFP Below Forecasts, Fed Bets Repriced - CPT Markets

EBC Markets Briefing | Crude prices up as inventory extended decline


