DJI30 Outlook

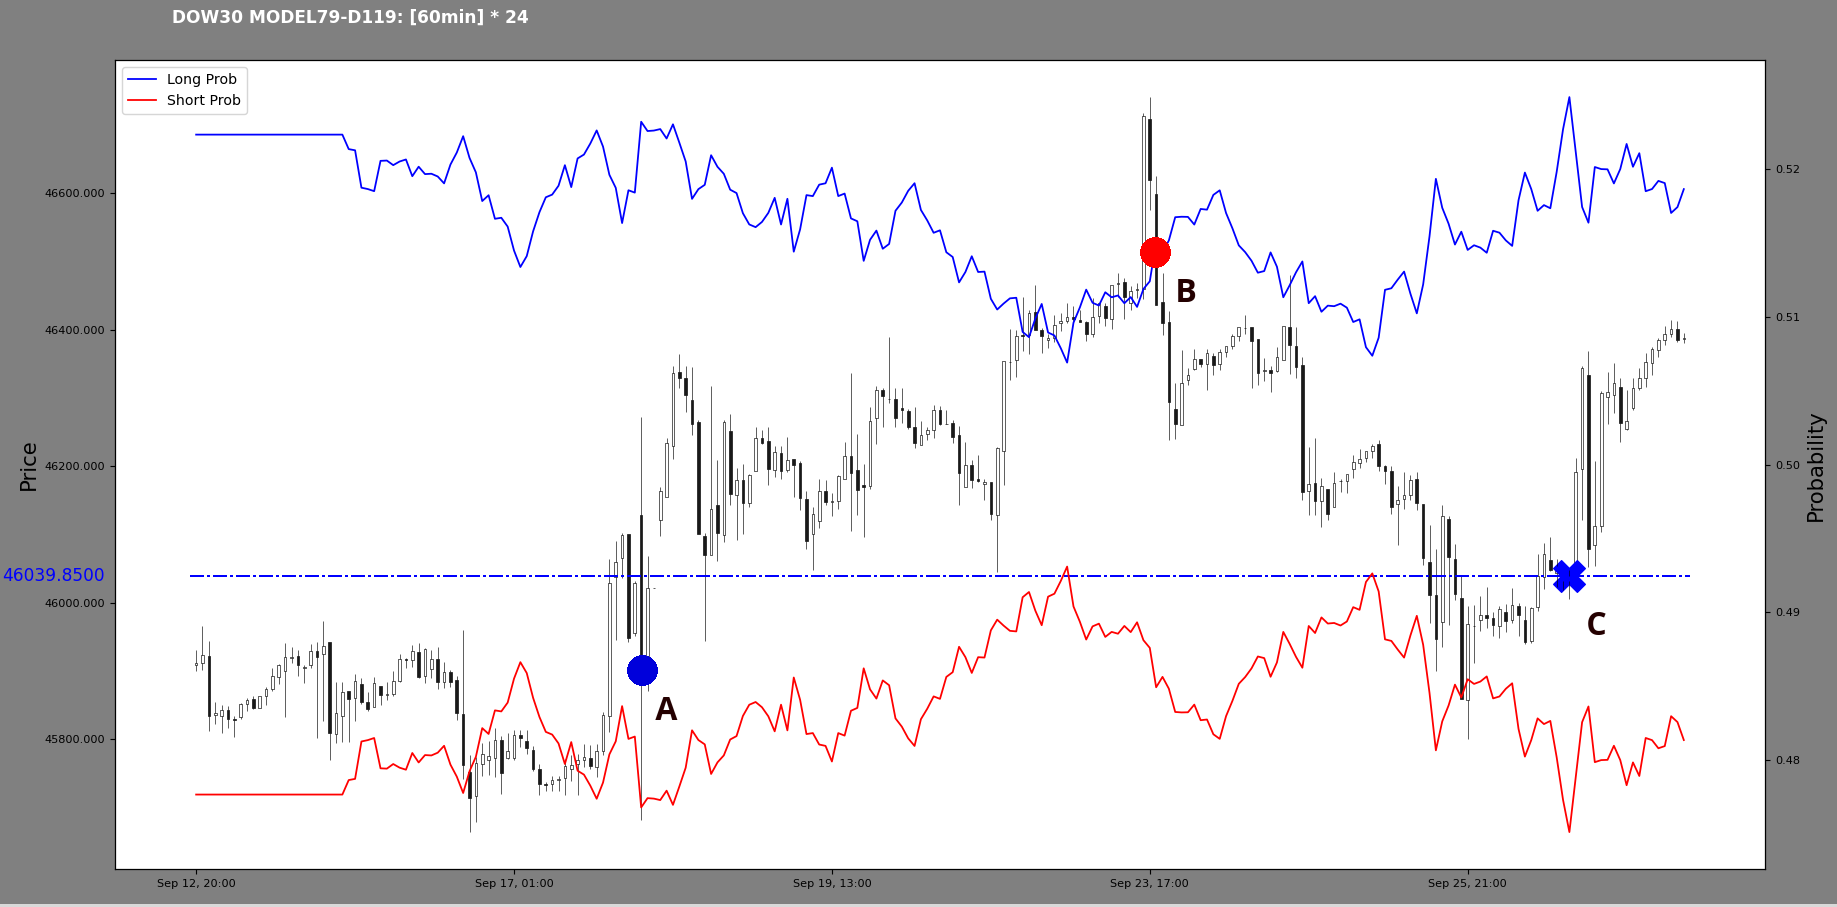
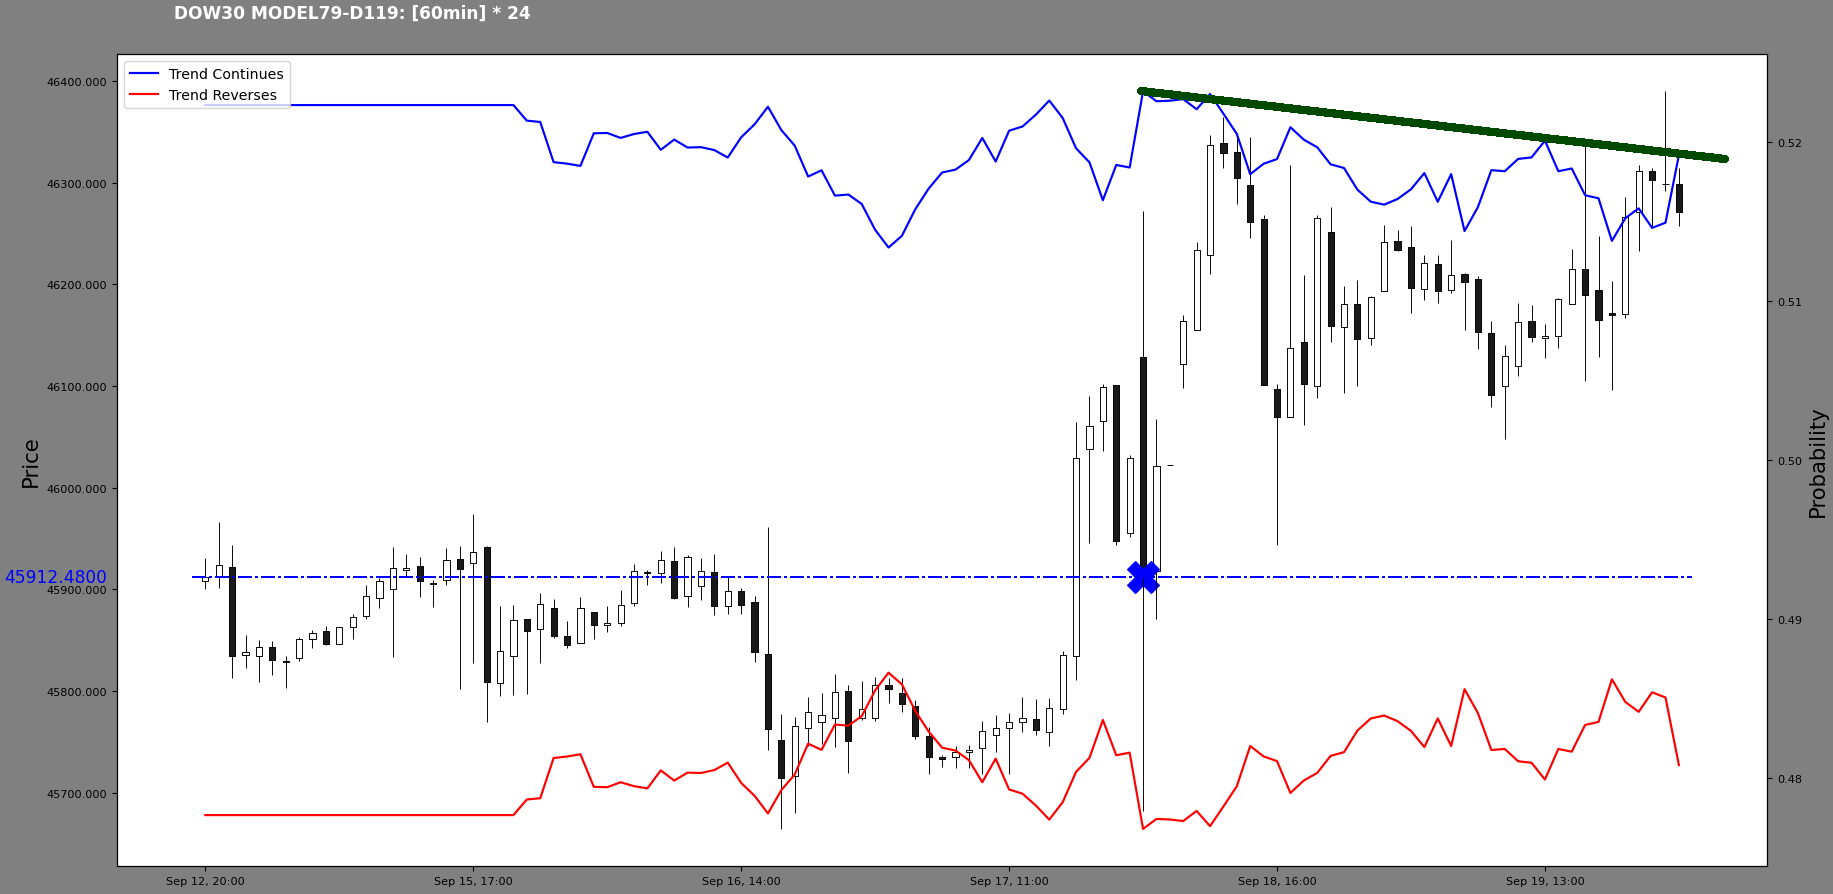
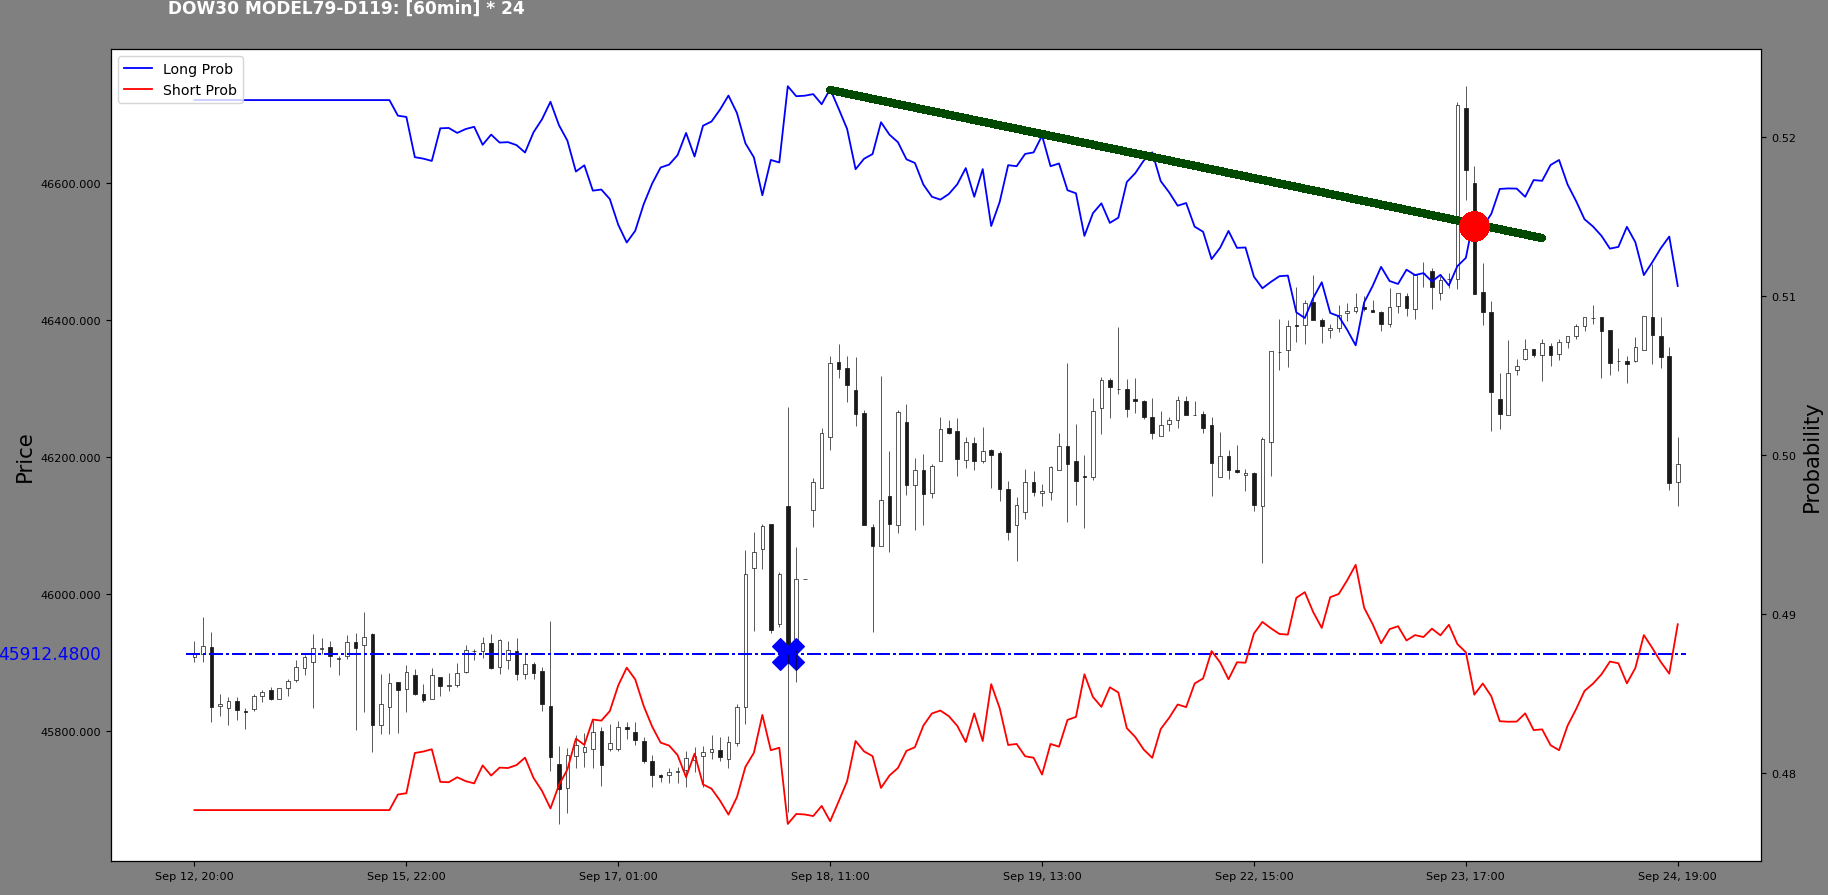
The DJI30 has formed a long probability peak at 45912.48. Probability trend is up, long prob constantly above the down prob. Now, there is a probable structure break - if up probability goes stable above the green line, we expect the index to go down in search of a new up probability maximum.

kolev posted:
The DJI30 has formed a long probability peak at 45912.48. Probability trend is up, long prob constantly above the down prob. Now, there is a probable structure break - if up probability goes stable above the green line, we expect the index to go down in search of a new up probability maximum.
 what say you guys?!
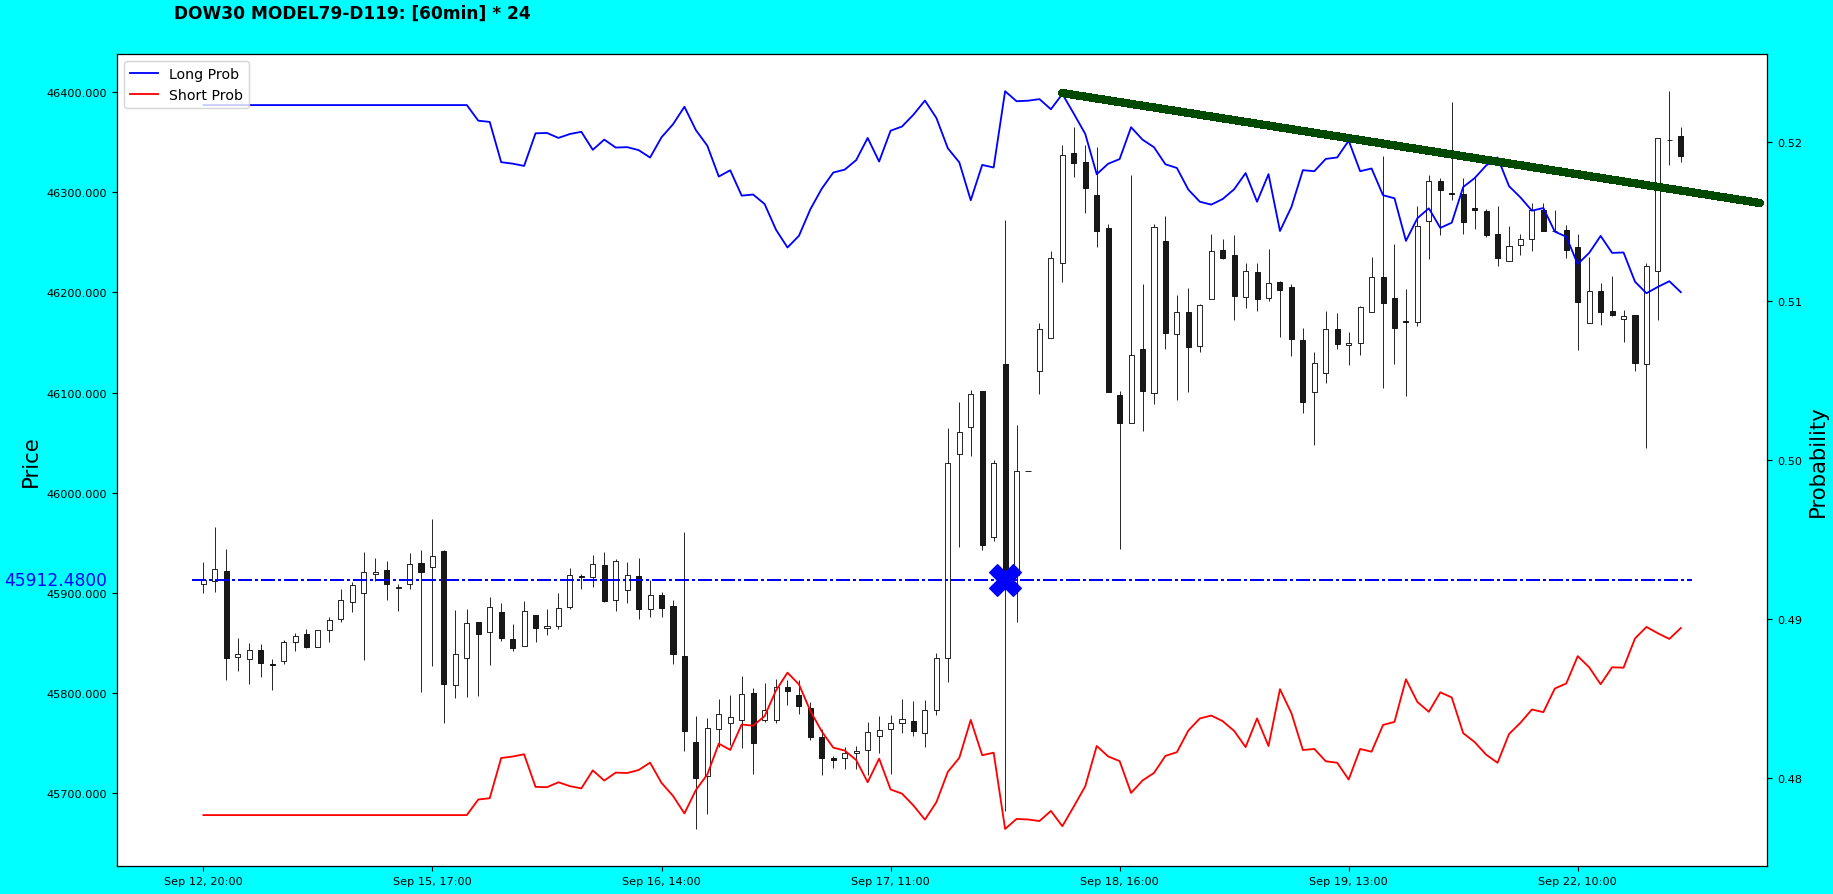
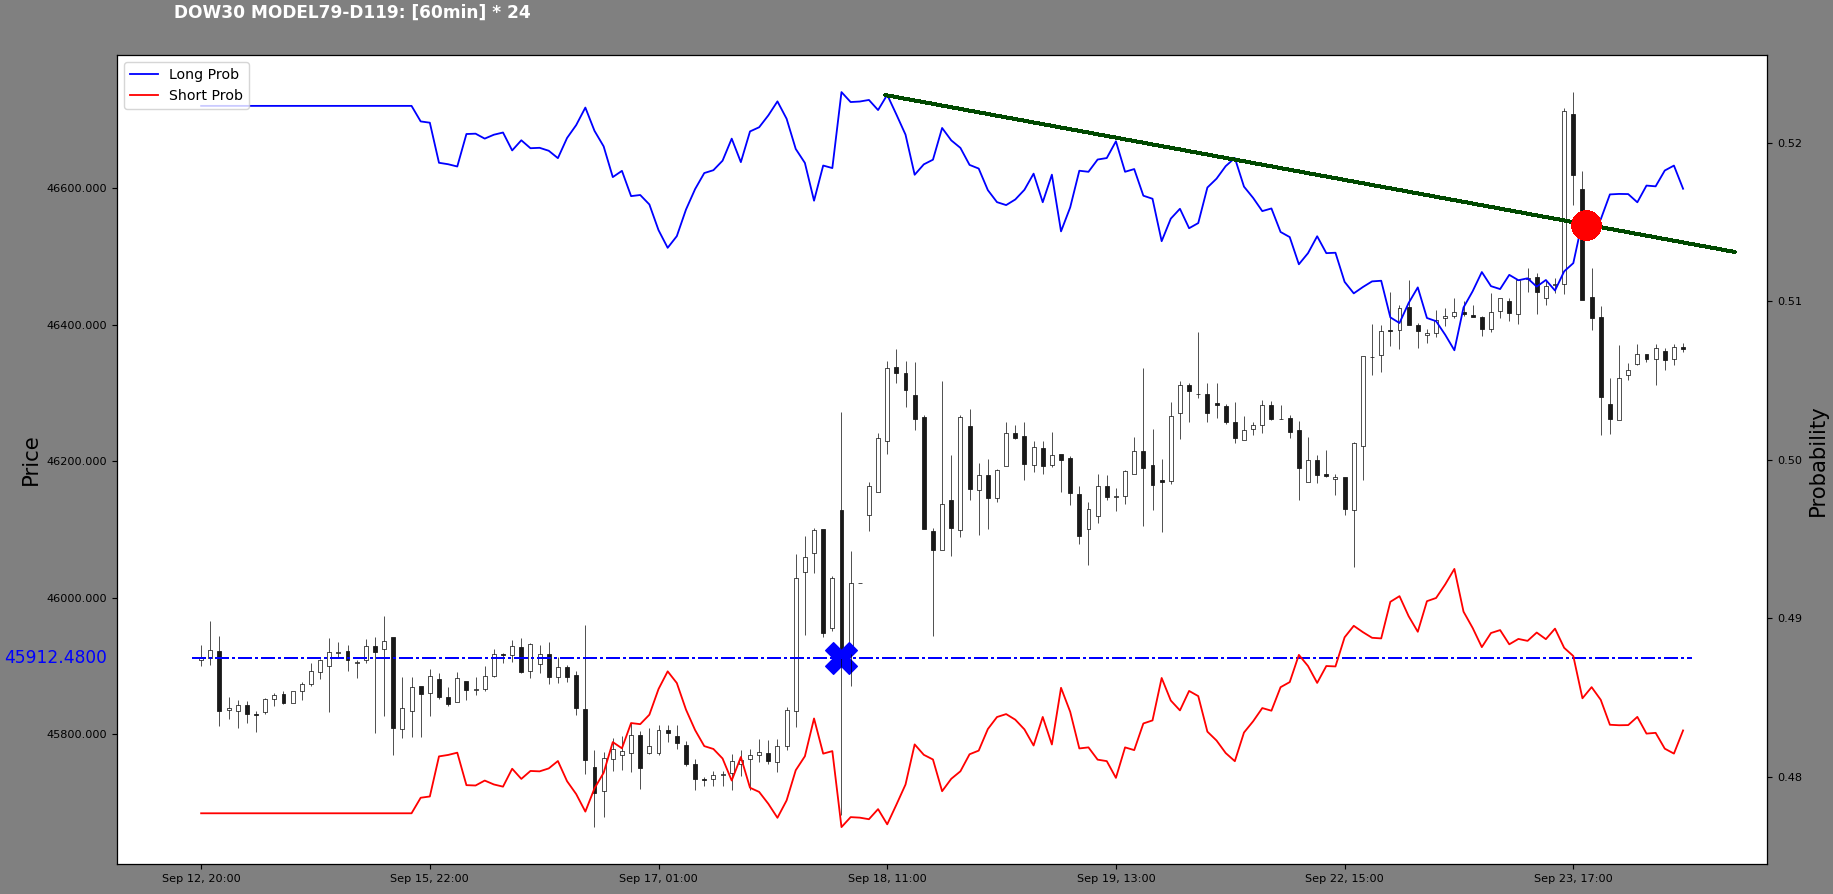
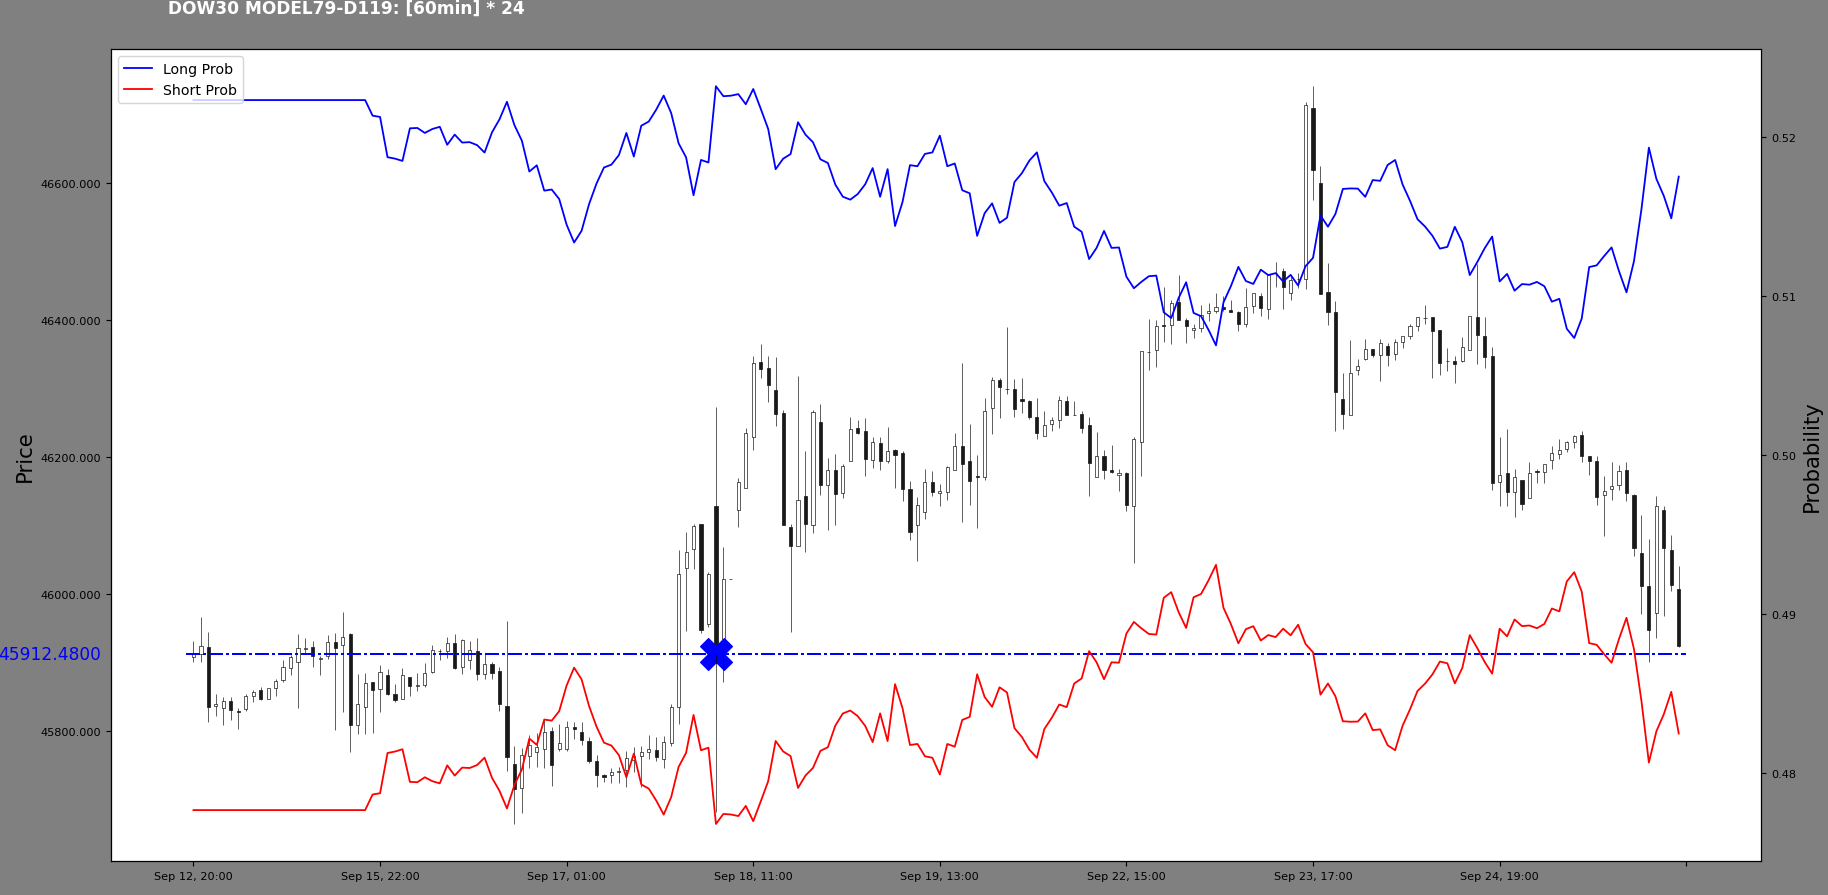
Now, the DJI30 will either confirm its present long probability peak at 45912.48 (which has not currently been broken) or form a new long probability peak. Since a second peak is not formed yet, I hold the first scenario more probable. Which confirms the above trend you noticed.

DSikora posted:Thanks for the analysis and graphs.Interesting.
well im not sure who you addressed this to, if i was included, thanks a lot. :) but dont trade based on my analysis, i would not take the responsibility :D