


Advertisement
Bitcoin (BTC) analysis thread

Jan 19, 2020 at 20:58
Hi all and Happy New Year. Wishing you an awesome and profitable one to be. As first BTC analysis for the year it will be more really long term so let`s get to the point.
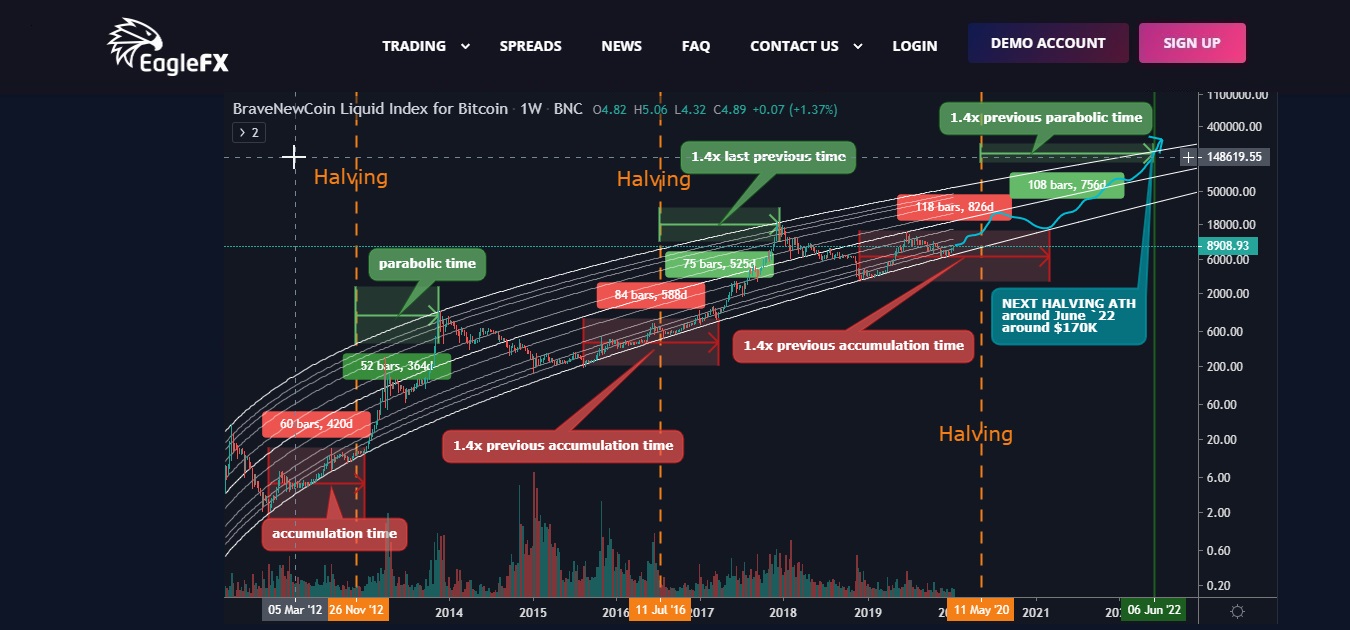
It was a good price movement lately and I really believe that the $6.4K level was the bottom.
Everything which i`ll say from here is situated on historical PA and a bit of math. From now i`m expecting the 2nd small parabolic move which must take place till the next summer may be, followed by descending before the 3rd big parabolic move which must take us to the next halving cycle ATH. That`s the first PA, which I can call it “1,2,3 steps”, move made by BTC in previous halving cycles. The second one is the bigger accumulation/parabolic periods in BTC`s PA history. Every time they`re getting 1.4 times longer than previous one.
So judging by this two PA I can assume that the next BTC All Time High will be… in June 2022 and the price will be somewhere around… $170K. That`s insane!!!
I just want to say 3 more things:
1. This is just a prognosis. It`s 50:50. It can become real or no but at this point that`s how i`m seeing the BTC PA future and that`s only my (or may be not only my) opinion.
2. I`m not talking about May`s halving and the price then cuz it`s coming very soon and i`m a really long term HODLer.
3. Starting from the previous two points that`s a really long term analysis. I`ll be more specific in short or mid-term period into next week analysis.
付属品:
momchil_slavov@

May 14, 2019からメンバー
26 投稿
Jan 22, 2020 at 18:08
Honestly I do not believe that the BTC will be somewhere around that levels anyway. How we can go further with that matter totally and completely? I wish I was able to invest in BTC when it was worth peanuts and will sit now and discuss what to do with it honestly.
Jan 26, 2020 at 20:10
Felhagamand posted:
Honestly I do not believe that the BTC will be somewhere around that levels anyway. How we can go further with that matter totally and completely? I wish I was able to invest in BTC when it was worth peanuts and will sit now and discuss what to do with it honestly.
Everybody have his own opinion. I`m curious why you`re thinking that the BTC will not reach that levels?
momchil_slavov@
Feb 02, 2020 at 21:26
Hi all. The first month for 2020 already passed and it was hell of a good month for BTC. Hope that`s just a preview for the whole year. Last time i`ve presented to you a really long term analysis so let`s get back to shorter ones.
Beside of all financial markets, today was a really hot day for the winter season (around 20 degrees) and that`s why i`ve been on a pleasant walk with my wife and friends. That`s why i`m kind of tired now and i`ll be really short but punctual in my analysis.
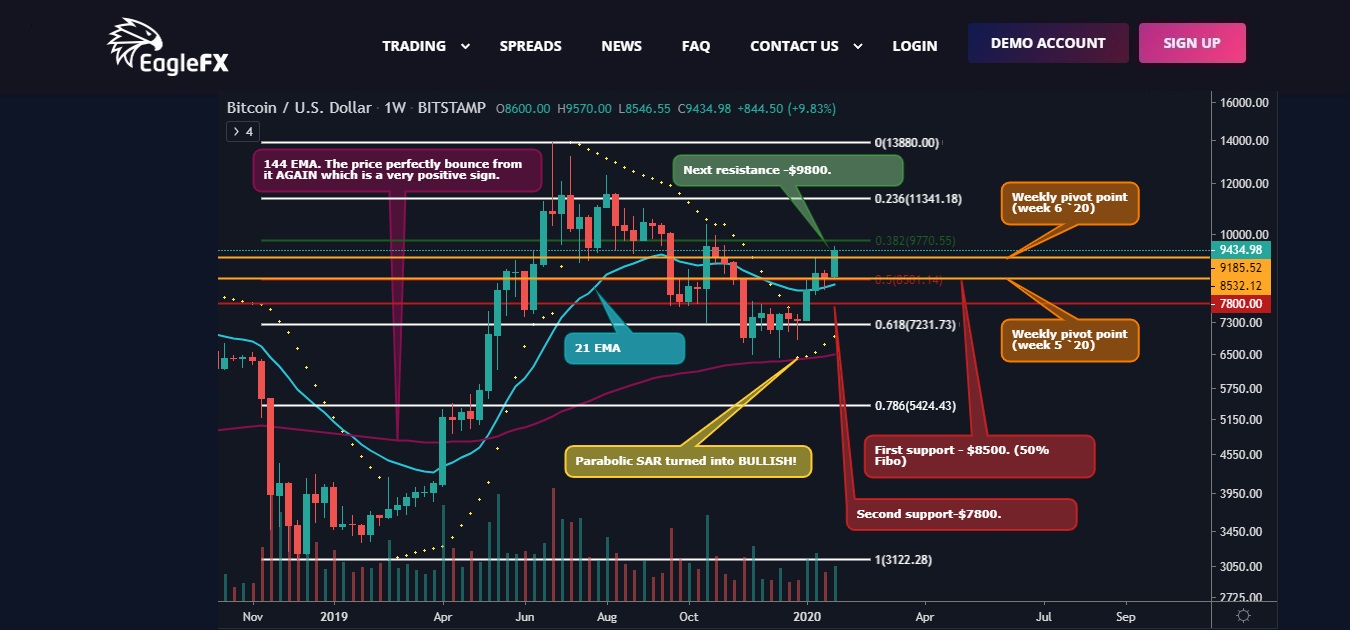
The graph is not really changed except the new support and resistance levels and 2 newly added indicators.
Two support levels:
1. $8500 - previous resistance and 50% fibo level
2. $7800 - previous resistance level
Resistance level: $9800 - previous resistance and 38.2% fibo level
What about the newly added indicators? Here they are:
1. Pivot point. A pivot point is a technical analysis indicator, or calculations, used to determine the overall trend of the market over different time frames. The pivot point itself is simply the average of the high, low and closing prices from the previous trading day. On the subsequent day, trading above the pivot point is thought to indicate ongoing bullish sentiment, while trading below the pivot point indicates bearish sentiment.
The pivot point is the basis for the indicator, but it also includes other support and resistance levels that are projected based on the pivot point calculation. All these levels help traders see where the price could experience support or resistance. Similarly, if the price moves through these levels it lets the trader know the price is trending in that direction.
Last weeks the price was consistently above PP levels. As you`ll see we`ll close this week above it again (Weekly pivot point (week 5 `20)). I`m calculating the next week PP level on a $9440 closing price. It can change a bit cuz this week candle is now yet closed but if the closing price is around $9440 it will be similar.
2. Parabolic SAR. I`ll not go in deep into explanation what is PSAR but if you want to learn more about it here`s a good article about it - https://www.forex.academy/profitable-trading-computerized-studies-iii-psar/ . The most important here is that PSAR is turned back to bullish after the price top back in July last year. If that`s not a strong bullish signal I don`t know what can be.
That`s for now from me guys. Wishing you a wonderful and prosper week and month.
付属品:
momchil_slavov@
Feb 07, 2020からメンバー
5 投稿
Feb 07, 2020 at 12:19
momo3HC posted:
Hi all. The first month for 2020 already passed and it was hell of a good month for BTC. Hope that`s just a preview for the whole year. Last time i`ve presented to you a really long term analysis so let`s get back to shorter ones.
Beside of all financial markets, today was a really hot day for the winter season (around 20 degrees) and that`s why i`ve been on a pleasant walk with my wife and friends. That`s why i`m kind of tired now and i`ll be really short but punctual in my analysis.
The graph is not really changed except the new support and resistance levels and 2 newly added indicators.
Two support levels:
1. $8500 - previous resistance and 50% fibo level
2. $7800 - previous resistance level
Resistance level: $9800 - previous resistance and 38.2% fibo level
What about the newly added indicators? Here they are:
1. Pivot point. A pivot point is a technical analysis indicator, or calculations, used to determine the overall trend of the market over
different time frames. The pivot point itself is simply the average of the high, low and closing prices from the previous trading day. On the subsequent day, trading above the pivot point is thought to indicate ongoing bullish sentiment, while trading below the pivot point indicates bearish sentiment.
The pivot point is the basis for the indicator, but it also includes other support and resistance levels that are projected based on the pivot point calculation. All these levels help traders see where the price could experience support or resistance. Similarly, if the price moves through these levels it lets the trader know the price is trending in that direction.
Last weeks the price was consistently above PP levels. As you`ll see we`ll close this week above it again (Weekly pivot point (week 5 `20)). I`m calculating the next week PP level on a $9440 closing price. It can change a bit cuz this week candle is now yet closed but if the closing price is around $9440 it will be similar.
2. Parabolic SAR. I`ll not go in deep into explanation what is PSAR but if you want to learn more about it here`s a good article about it - https://www.forex.academy/profitable-trading-computerized-studies-iii-psar/ . The most important here is that PSAR is turned back to bullish after the price top back in July last year. If that`s not a strong bullish signal I don`t know what can be.
That`s for now from me guys. Wishing you a wonderful and prosper week and month.
Thank you, your point of view is very interesting. I will wait to continue.

Apr 09, 2019からメンバー
516 投稿
Feb 10, 2020 at 08:35
Signs are good for another push. I just hope this isn't a false bull run due to people stocking up on it as safe haven with all the drama in the world at the moment.
If you can't spot the liquidity then you are the liquidity.

Feb 10, 2020からメンバー
11 投稿
Feb 10, 2020 at 12:55
Great analysis. Good to seem some proper BTC analysis on myfxbook rather than just random chat

Mar 18, 2019からメンバー
97 投稿
Feb 10, 2020 at 13:19
any analysis for the weekend til today mate? there was a big spike lets just hope it continues north
Feb 10, 2020からメンバー
2 投稿
Feb 10, 2020 at 13:25
I have not been in this business for a long time. But it’s never too late to study. I like this resource.
Feb 16, 2020 at 15:54
AdamCantor posted:
any analysis for the weekend til today mate? there was a big spike lets just hope it continues north
I thought to chart up something these days but probably i`ll wait for the weekly candle close and make it tomorrow.
momchil_slavov@
Sep 16, 2019からメンバー
10 投稿
Feb 17, 2020 at 15:07
The recent rise in BTC following the outbreak of coronavirus has confirmed belief that BTC is digital gold. There will be a rush to BTC next time there are any economic jitters. I will be buying dips from now on
Apr 09, 2019からメンバー
516 投稿
Feb 24, 2020 at 08:07
I can see a continuation of the upward trend happening this week. All the techincals are pointing towards a bull run and combined with the threat of CV popping up more in Europe and other countries outside China we could see a continuing trend of BTC being used as a safe haven.
If you can't spot the liquidity then you are the liquidity.

Nov 06, 2018からメンバー
81 投稿
Mar 06, 2020 at 12:23
I wonder when this will actually happen? Bitcoin has been staling for a while now, maybe they are waiting for halving to come into action before flying it up?


