Advertisement
Bitcoin (BTC) analysis thread

Jun 07, 2020 at 14:08
Hi all. Kind a long time no see from me but this time you`ve got to excuse me again. I`m not in a mood for some big charting so i`ll be short and share with you the actual weekly chart from the last time plus some new Stock to flow model.
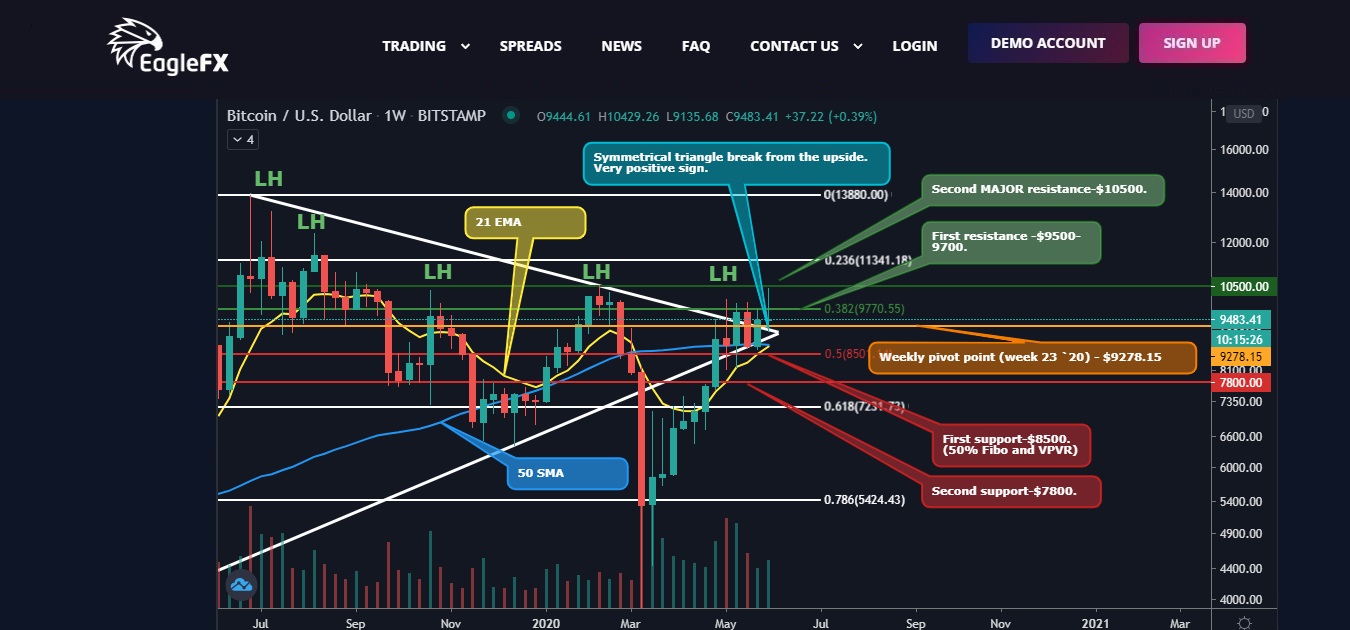
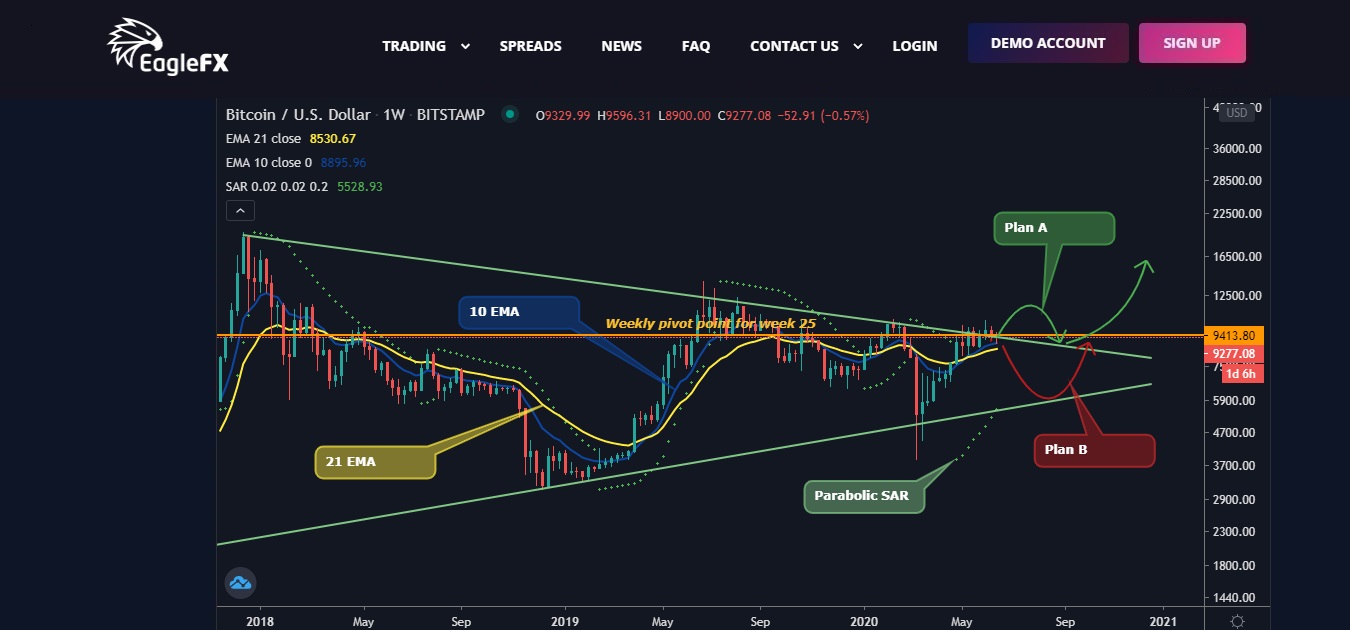
Actual situation (chart 1).
Support and resistance:
Support:
1st support - $8500 - 50% Fibo and VPVR profile
2nd support - $7800
Resistance:
1st resistance - $9500-9800
2nd resistance - $10500 – that will be a MAJOR resistance not only for the mid-term but also in a long-term, on the way to the next ATH like mentioned above.
Weekly pivot point is $9278.15.
50 SMA is below the price for now.
21 EMA is below the price for now.
We`re very close to a bullish cross between 21EMA and 50SMA but let`s wait for confirmation.
Whole this week candle is above the symmetrical triangle. Very positive sign.
As a conclusion i`m expecting a positive next week.
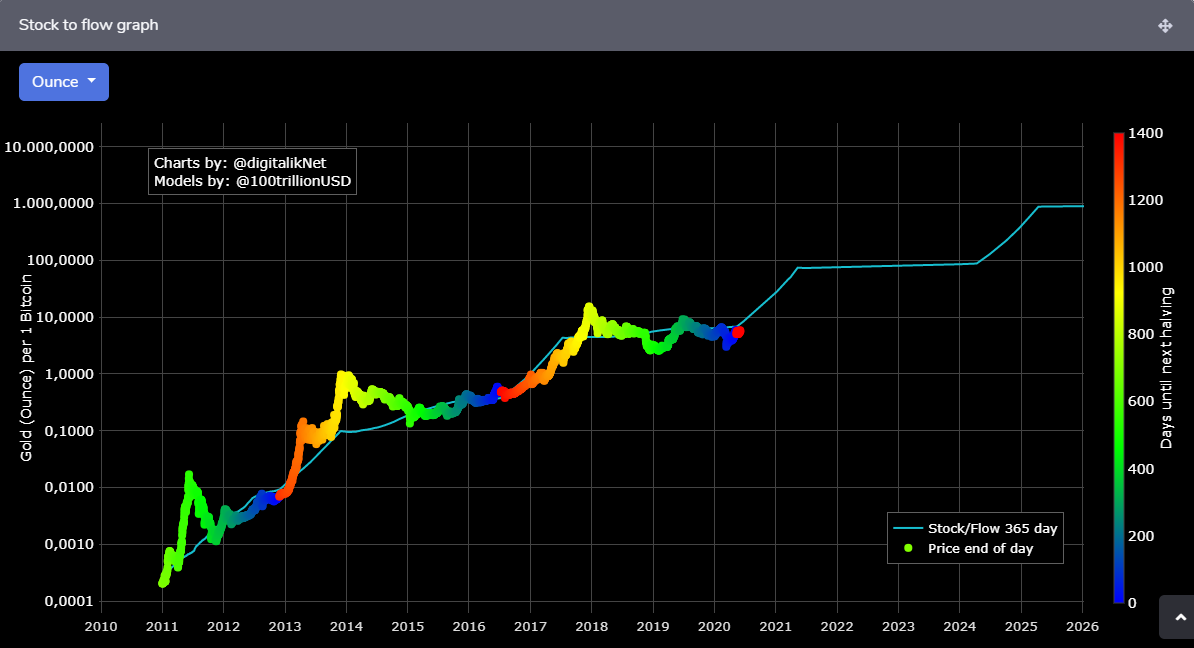
New Stock to flow model. (chart 2).
With the actual money printing and very possible inflation and even hyperinflation the future BTC price can reach $100k, $1mil. and more. But what will be the purchase power of this $100k or $1mil.? I think that`s the big question. Unlike the FIAT, Gold is gold. No matter now, before 100 of years or after 100 of years. That`s why the latest BTC vs Gold Stock to flow model is getting more important. Just check the chart.
That`s all for now.
See ya next time.
付属品:
momchil_slavov@

Apr 09, 2019からメンバー
516 投稿
Jun 07, 2020 at 14:26
Shame it rejected the $10500 mark again. Hopefully some more consolidation a $9500 before another go
If you can't spot the liquidity then you are the liquidity.
Jun 20, 2020 at 18:43
Hi all. A lot of things happened lately and here I am again. This time only BTC chart (a weekly one) and no other distraction.
You can ask why and the answer is very simple – I want to be strictly price action orientated this time.
We saw a lot of movement in both directions but as you`ll see from the chart – nothing major changed.
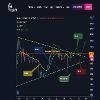
Actual situation.
The price is trying to breach the upside line but can`t do it. Only a small fake out for now. The game is not over yet.
10 EMA – the price perfectly bounced from it this week and it`s back above.
21 EMA - the price is still above it.
Correlation between 10 and 21 EMA – Despite the Corona drop every time when the 10 EMA is above the 21 EMA and the price is above both we can predict a very good bull period.
Parabolic SAR – 8 weeks bullish signaling.
Weekly pivot point is $9413.80 – 50:50 possibility to close the week below it which can lead to negative next week.
Support and resistance:
7.1. Support:
1st support - $8500 - 50% Fibo and VPVR profile
2nd support - $7800
7.2. Resistance:
1st resistance - $9500-9800
2nd resistance - $10500 – that will be a MAJOR resistance not only for the mid-term but also in a long-term, on the way to the next ATH like mentioned above.
So as a conclusion theres plan A and B. Im 70:30 for plan A but who knows.
There`s no matter for me in long term. Both scenarios ends with the same final so BE HEALTHY and HODL.
That`s all for now.
See ya next time.
付属品:
momchil_slavov@
Apr 09, 2019からメンバー
516 投稿
Jun 22, 2020 at 08:44
Plan A possibly but it has been hard to gauge recently.
If you can't spot the liquidity then you are the liquidity.

Jun 22, 2020 at 09:40
momo3HC posted:
Hi all. A lot of things happened lately and here I am again. This time only BTC chart (a weekly one) and no other distraction.
You can ask why and the answer is very simple – I want to be strictly price action orientated this time.
We saw a lot of movement in both directions but as you`ll see from the chart – nothing major changed.
Actual situation.
The price is trying to breach the upside line but can`t do it. Only a small fake out for now. The game is not over yet.
10 EMA – the price perfectly bounced from it this week and it`s back above.
21 EMA - the price is still above it.
Correlation between 10 and 21 EMA – Despite the Corona drop every time when the 10 EMA is above the 21 EMA and the price is above both we can predict a very good bull period.
Parabolic SAR – 8 weeks bullish signaling.
Weekly pivot point is $9413.80 – 50:50 possibility to close the week below it which can lead to negative next week.
Support and resistance:
7.1. Support:
1st support - $8500 - 50% Fibo and VPVR profile
2nd support - $7800
7.2. Resistance:
1st resistance - $9500-9800
2nd resistance - $10500 – that will be a MAJOR resistance not only for the mid-term but also in a long-term, on the way to the next ATH like mentioned above.
So as a conclusion theres plan A and B. Im 70:30 for plan A but who knows.
There`s no matter for me in long term. Both scenarios ends with the same final so BE HEALTHY and HODL.
That`s all for now.
See ya next time.
The thing is there is a range from 9400 BTCUSD where traders buy and as soon as it get close to 10,000 they sell.
So 10,000 is svery strong resistance.
Even breaking 10,000 is not enough. I believe unless we breach 10400 there will be no break out till the moon.
Jun 22, 2020 at 18:53
Watched a very good analysis on the BTC moment suggesting that there could be a big spike to the lower side around 6k mark which will hold for a day or 2 before we rally into the year and break the 15k by September. half tempted to set some limit orders and see if i can get in on the drop.
Jun 23, 2020 at 12:13
Pezza posted:
Watched a very good analysis on the BTC moment suggesting that there could be a big spike to the lower side around 6k mark which will hold for a day or 2 before we rally into the year and break the 15k by September. half tempted to set some limit orders and see if i can get in on the drop.
Every good analyses should have statement that it is not investment reccommendation :)
Jun 28, 2020 at 10:44
Hi all. A boring week for me even with almost $1000 from the bottom to the peak of the BTC price.
This week will be only a small update from the last one plus one bullish chart and opinion from Bloomberg. I`m expecting next week and end of the month for more conclusions.
Actual situation. (chart 1)
1. The price is still trying to breach the upside line but still can`t do it.
2. 10 EMA – the price almost perfectly bounced from it again this week and it`s back above (for now).
3. 21 EMA - the price is still above it even without a touch of it.
4. Correlation between 10 and 21 EMA – Despite the Corona drop every time when the 10 EMA is above the 21 EMA and the price is above both we can predict a very good bull period.
5. Parabolic SAR – 9 weeks bullish signaling.
6. Weekly pivot point is $9259.78 – a similar scenario like the last week. Sorry to say it but seems like we`ll end this week below it which can lead to another negative week next week, and remember that almost In the middle of it will be the end of the month.
7. Support and resistance:
7.1. Support:
1st support - $8500 - 50% Fibo and VPVR profile
2nd support - $7800
7.2. Resistance:
1st resistance - $9500-9800
2nd resistance - $10500 – that will be a MAJOR resistance not only for the mid-term but also in a long-term, on the way to the next ATH like mentioned above.
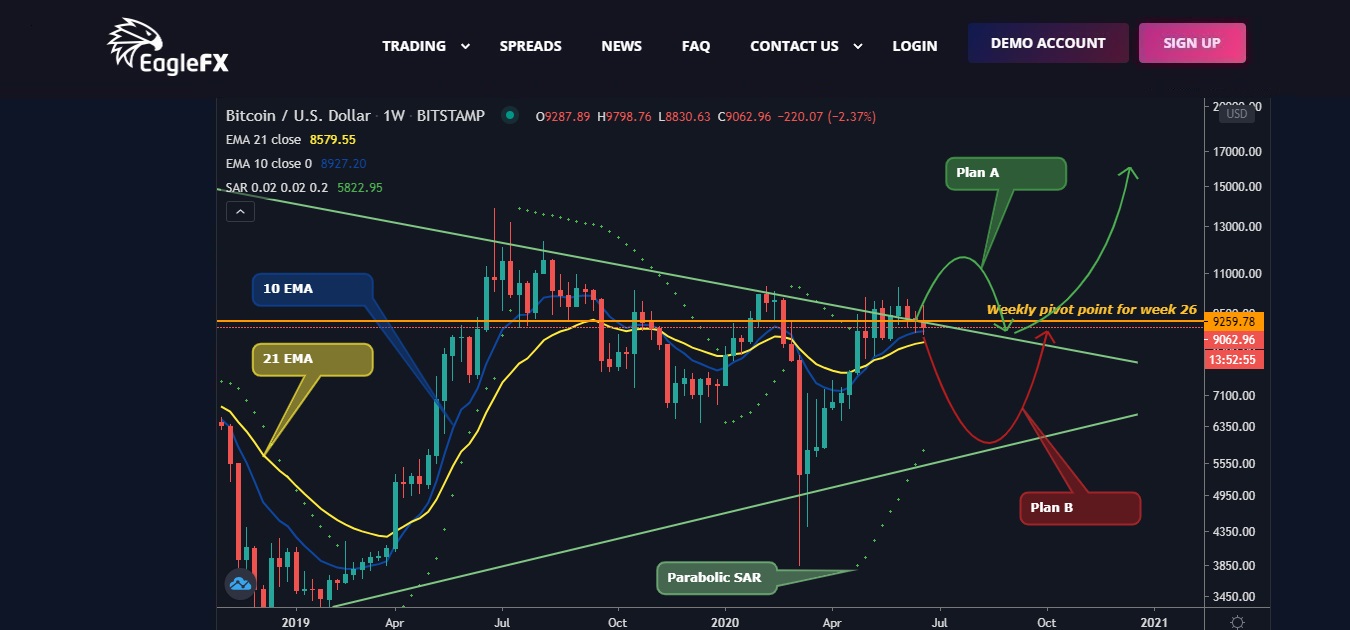
A Bloomberg view. (chart 2)
According to Bloomberg, the narrowest ever bollinger bands suggest that Bitcoin is consolidating for a major breakout. In their opinion, Bitcoin is priming to break out of the upper resistance level of $13,000. At the same time, he says that it is critical that price does not fall below $6,500. For more perspective check their chart.
That`s all for now and let`s hope for a better end of the month than the actual one.
See ya next time.
付属品:
momchil_slavov@
Apr 09, 2019からメンバー
516 投稿
Jun 29, 2020 at 09:53
Sitting on my hands for now. Waiting for it to show its hand some more
If you can't spot the liquidity then you are the liquidity.

Mar 18, 2019からメンバー
97 投稿
Jun 29, 2020 at 18:58
momo3HC posted:
Hi all. A boring week for me even with almost $1000 from the bottom to the peak of the BTC price.
This week will be only a small update from the last one plus one bullish chart and opinion from Bloomberg. I`m expecting next week and end of the month for more conclusions.
Actual situation. (chart 1)
1. The price is still trying to breach the upside line but still can`t do it.
2. 10 EMA – the price almost perfectly bounced from it again this week and it`s back above (for now).
3. 21 EMA - the price is still above it even without a touch of it.
4. Correlation between 10 and 21 EMA – Despite the Corona drop every time when the 10 EMA is above the 21 EMA and the price is above both we can predict a very good bull period.
5. Parabolic SAR – 9 weeks bullish signaling.
6. Weekly pivot point is $9259.78 – a similar scenario like the last week. Sorry to say it but seems like we`ll end this week below it which can lead to another negative week next week, and remember that almost In the middle of it will be the end of the month.
7. Support and resistance:
7.1. Support:
1st support - $8500 - 50% Fibo and VPVR profile
2nd support - $7800
7.2. Resistance:
1st resistance - $9500-9800
2nd resistance - $10500 – that will be a MAJOR resistance not only for the mid-term but also in a long-term, on the way to the next ATH like mentioned above.
A Bloomberg view. (chart 2)
According to Bloomberg, the narrowest ever bollinger bands suggest that Bitcoin is consolidating for a major breakout. In their opinion, Bitcoin is priming to break out of the upper resistance level of $13,000. At the same time, he says that it is critical that price does not fall below $6,500. For more perspective check their chart.
That`s all for now and let`s hope for a better end of the month than the actual one.
See ya next time.
good stuff here!! very detailed. keep this coming! thanks for sharing bro
Jul 05, 2020 at 10:58
Hi all. A boring week again.
This week i`m going a bit long-term again with 2 charts again.
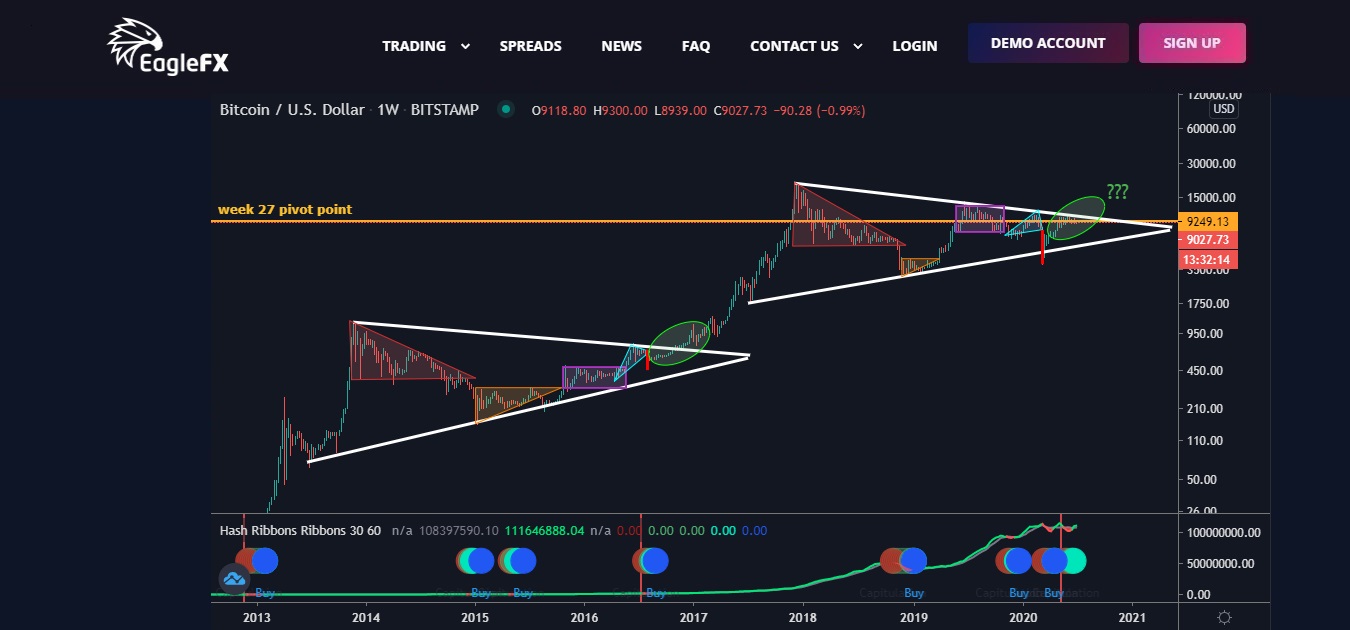
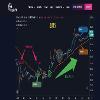
Can the history be repeated? (chart 1)
It`s not 100% sure that the history be repeated but since now it looks like it`s happening even with some little differences but they`re insignificant. I`ll not say much more and will let you to think about this pattern.
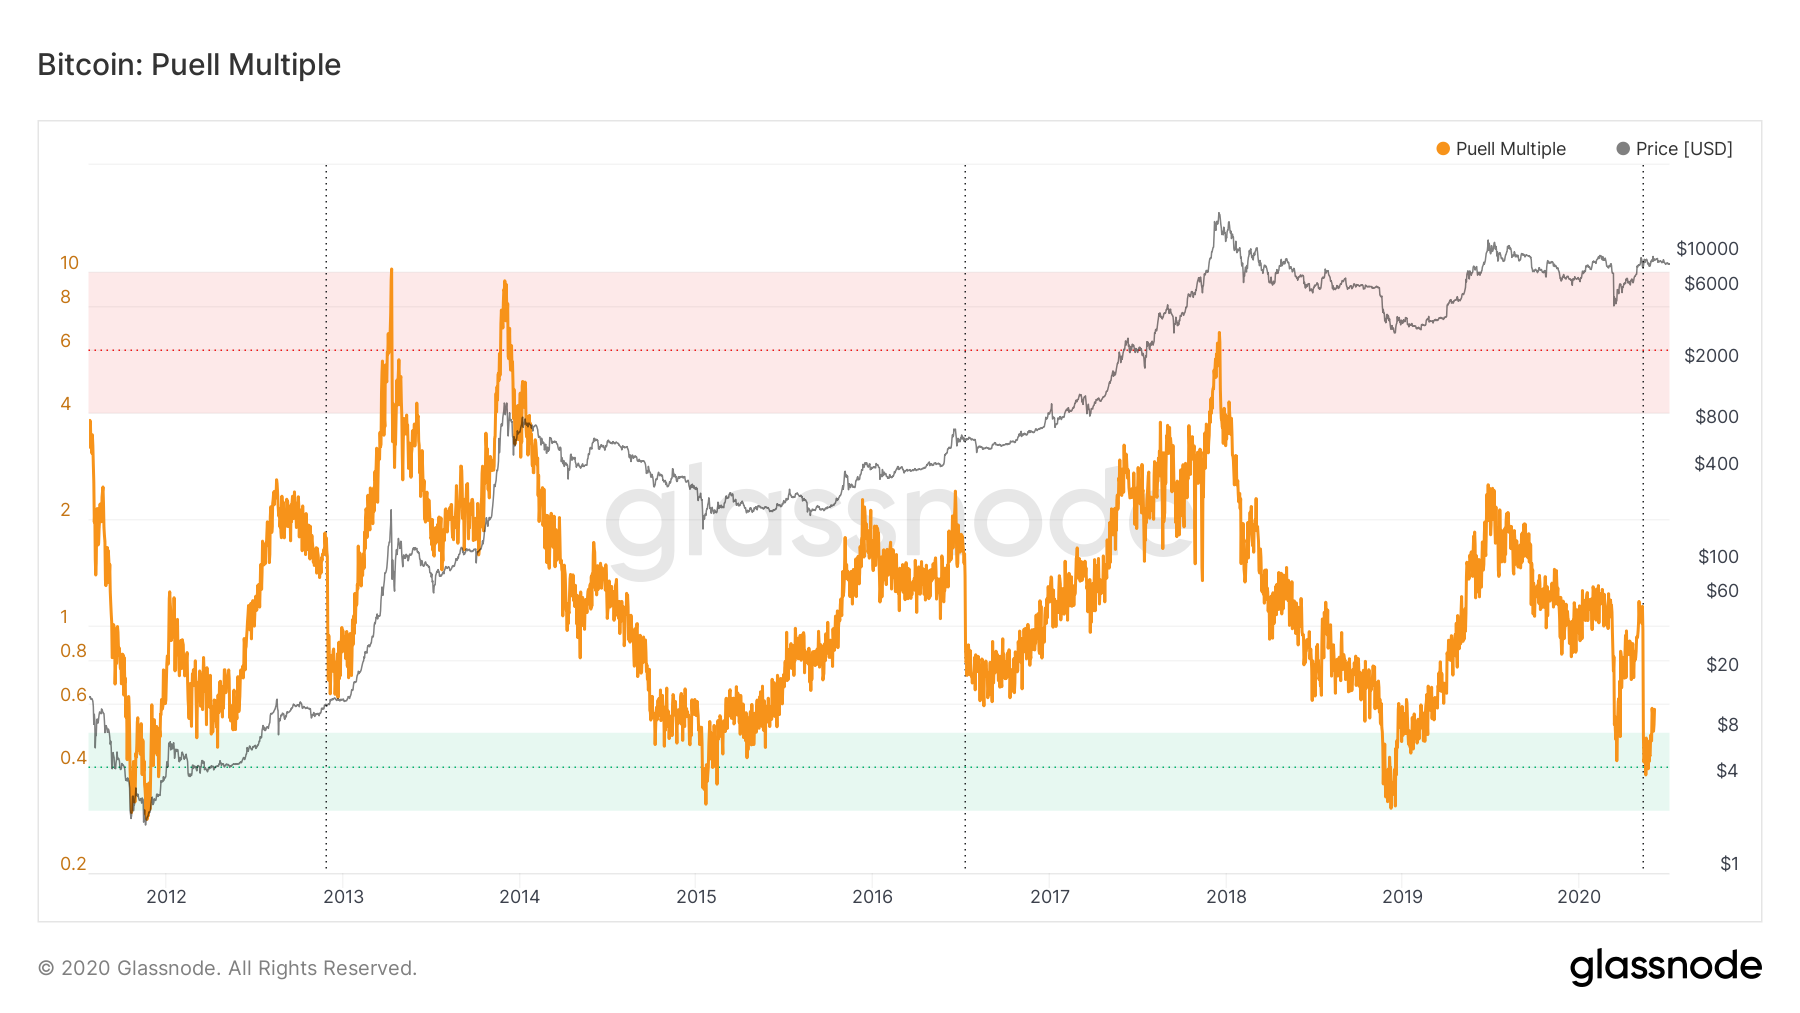
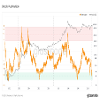
Bitcoin Puell multiple. (chart 2)
This is something really interesting too. Thanks to Glassnode and their Puell multiple (PM) chart we can see a never failed since now bullish signal and even more. We saw this signal in the past is 100% right and now it`s even confirmed cuz the PM line went down to the green zone, then went up out of it, then back down but it bounced almost at the border and went back up. You can check this chart on their site.
Actual PA situation:
1. The price is still trying to breach the upside line but still can`t do it.
2. 10 EMA – the price is perfectly bouncing from it again.
3. 21 EMA - the price is still above it even without a touch of it.
4. Correlation between 10 and 21 EMA – Despite the Corona drop every time when the 10 EMA is above the 21 EMA and the price is above both we can predict a very good bull period.
5. Parabolic SAR – Another bullish week and there`s 10 weeks bullish signaling.
6. Weekly pivot point is $9249.13 – a similar scenario like the last two weeks. Sorry to say it again but seems like we`ll end this week below it which can lead to another negative (3rd) week next week.
7. Support and resistance:
7.1. Support:
1st support - $8500 - 50% Fibo and VPVR profile
2nd support - $7800
7.2. Resistance:
1st resistance - $9500-9800
2nd resistance - $10500 – that will be a MAJOR resistance not only for the mid-term but also in a long-term, on the way to the next ATH like mentioned above.
That`s all for now.
See ya next time.
付属品:

momchil_slavov@
Apr 09, 2019からメンバー
516 投稿
Jul 06, 2020 at 08:54
Some great analysis. A real battleground between 9-10k
If you can't spot the liquidity then you are the liquidity.
Jul 11, 2020 at 09:18

Hi all. A bit more interesting week but nothing special.
Last week we`ve talked about history and can the it be repeated. This week i`ll continue with a 2in1 chart.
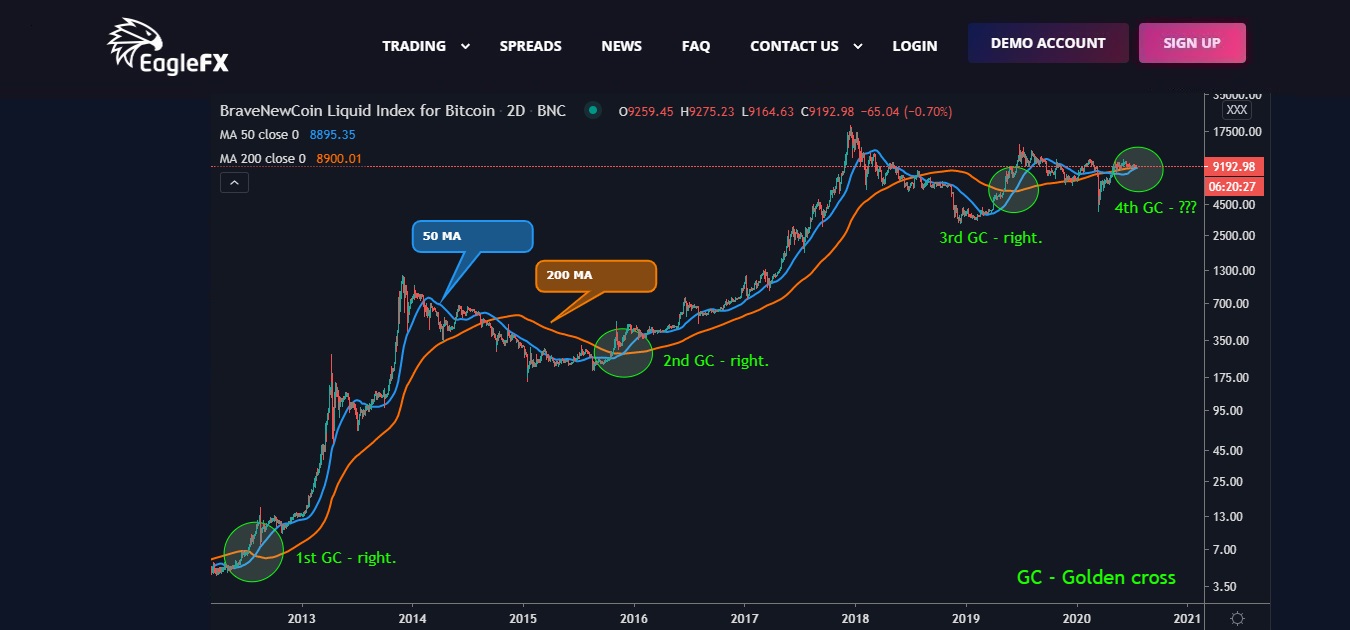
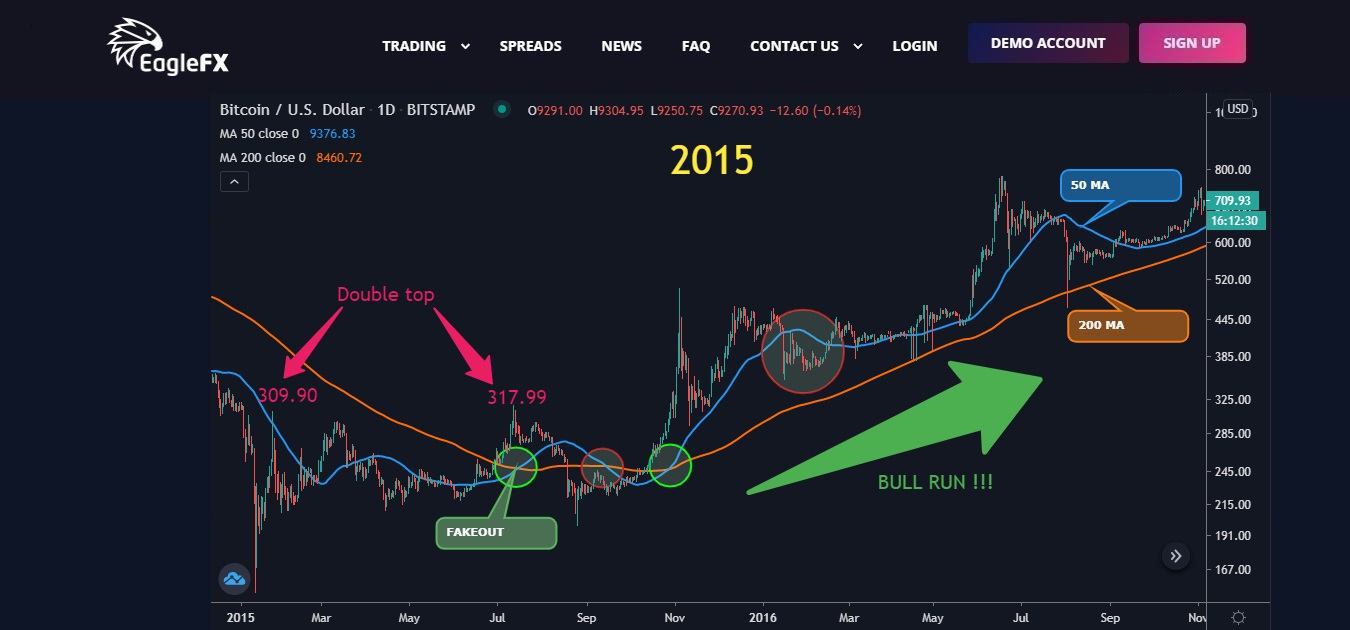
It`s simple enough and It`s all about Golden crosses (GC) and Death crosses (DC). I`m comparing the 2015 PA and GC/DC to the nowadays one. The GC are green circles and the DC are red ones. If someone don`t know what this crosses means – google it. Also If someone of you don`t know what happened after the end of 2015 lets check the charts. Till now the situation is 1:1 to the 2015, which is very interesting and let`s see how it will continue.
Actual PA situation:
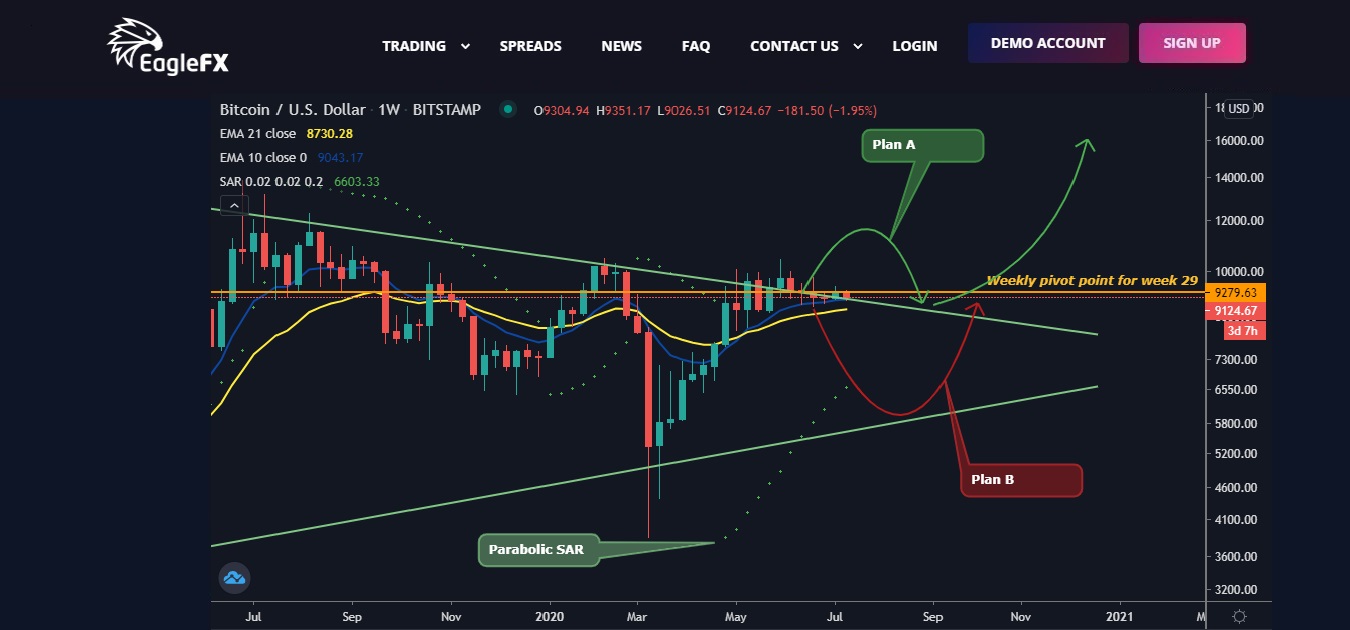
The price is still trying to breach the upside line and now it`s a bit higher than it but nothing significant.
10 EMA – the price is perfectly bouncing from it again.
21 EMA - the price is still above it even without a touch of it.
Correlation between 10 and 21 EMA – Despite the Corona drop every time when the 10 EMA is above the 21 EMA and the price is above both we can predict a very good bull period.
Parabolic SAR – Another bullish week and there`s 11 weeks bullish signaling.
Weekly pivot point is $9093.94 – there`s good signs that we`ll close the week above it, which will be very positive for the next week.
Support and resistance:
Support:
1st support - $8500 - 50% Fibo and VPVR profile
2nd support - $7800
Resistance:
1st resistance - $9500-9800
2nd resistance - $10500 – that will be a MAJOR resistance not only for the mid-term but also in a long-term, on the way to the next ATH like mentioned above.
For now, the next week material will be close to this but a bit more interesting and promising, if something significant does not happen.
That`s all for now.
See ya next time.
付属品:
momchil_slavov@
Apr 09, 2019からメンバー
516 投稿
Jul 13, 2020 at 12:09
Let's hope it is bullish. Needs to break out this tight range
If you can't spot the liquidity then you are the liquidity.