Market Insights & Trade Idea by AryanForex
Gold Technical Analysis
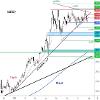
📉 Momentum Weakness After Channel BreakoutAfter breaking out of the falling channel, gold failed to surpass the $3356 resistance, showing weakening momentum.
📊 Technical Target: $3373–$3385If gold breaks above $3356, it could rise towards the $3373–$3385 range.
🔄 Possible Pullback to $3342Failure at resistance may trigger a price pullback to $3342.
🚀 Key Resistance at $3361Breaking $3361 on the daily chart could lead to a strong rally toward $3451.
⚠ Watch for Bearish BreakdownIf price drops to $3306, a bearish wedge pattern would be confirmed, targeting the $3216–$3261 zone.
Gold Pauses as Smart Money Signals High Pullback Risk 💡📉
Gold’s rally has paused, and the Smart Money Indicator suggests a higher risk of pullback.
📌 Since Monday’s U.S. session, spot gold has tested the $3400 resistance twice without success, now entering sideways movement near the highs.
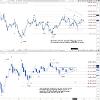
🧭 On the 1-hour chart, the Smart Money Indicator shows resistance from order blocks between $3393.5 and $3402.6, potentially limiting upside in the short term.
⚠ Unless gold reclaims above $3391.5, downside risk remains elevated.🛡 A support zone between $3345–3350 has formed from prior orders — if price retests but doesn’t break below, it may act as a bullish entry signal.
📌 For reference only — not financial advice.
📈 Gold on the Rise?
🔸 If gold holds above the key level of $3402, bulls may continue to gain momentum!🔸 Volume is building at higher levels, showing strong buyer interest.🔸 $3402 is a crucial support – staying above it opens the door to these targets:🎯 $3440–3450, $3470, $3500
🛡 Supports: $3402, $3384, $3370
✨ If the market holds here, gold may be set to test new highs again!
📝 (This analysis is for informational purposes only and not financial advice.)
#Gold #XAUUSD #GoldAnalysis #Forex #Commodities #TechnicalAnalysis #TradingSignals #MarketOutlook #goldprice #Jin10Data 📊💰🔥
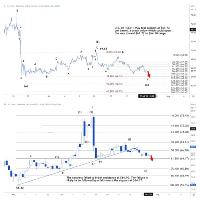
🌐 WTI Crude Oil Technical Analysis: Testing Key Support – Will the Downtrend Resume? 🛢️📉WTI crude oil is approaching the key support level at $64.72.A confirmed breakdown below this level could trigger a deeper pullback toward the $63.72–$64.10 range. ⚠️
The sharp decline on July 25 appears to confirm the end of the previous rebound, which had originated near this support.This also signals the continuation of the corrective wave C, which began from the $68.98 level.
🔹 Immediate resistance: $65.73🔹 A break above this level may pave the way for a rise toward the $66.35–$66.85 zone. 📈
On the daily chart, the failure to break through $66.90 resistance highlights weakening bullish momentum.This may initiate a new leg down, with support seen at $64.17.
Currently, the market is range-bound between $64.17 and $66.90.Only a decisive breakout from this range can provide a clearer directional signal. 🔍📊
Source: Reuters Commodity & Energy Analysts
📊 After two consecutive doji candles on the monthly chart, there is a possibility of a third doji forming in July. This pattern indicates that neither buyers nor sellers have fully taken control. Considering the sharp rise in gold prices over recent quarters and new historical highs, this price pattern seems logical and natural.
🔹 Although there was a slight rebound on Tuesday, after four days of decline, New York gold futures are still trying to hold the 50-day moving average support at $3,365.🔸 This support level is expected to break today, as the US dollar index remains strong after rising more than 1% on Monday. 💵
📉 This week’s candle isn’t very strong, indicating potential selling pressure that could start with a break below the $3,357 support, triggering a new selling wave.📈 On the other hand, if the price breaks the $3,402 resistance, the upward trend may continue, as the price is currently below the 9-day moving average resistance at $3,381.


