Advertisement
Market Insights & Trade Idea by AryanForex

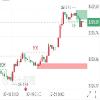
Gold Technical Analysis
📉 Momentum Weakness After Channel BreakoutAfter breaking out of the falling channel, gold failed to surpass the $3356 resistance, showing weakening momentum.
📊 Technical Target: $3373–$3385If gold breaks above $3356, it could rise towards the $3373–$3385 range.
🔄 Possible Pullback to $3342Failure at resistance may trigger a price pullback to $3342.
🚀 Key Resistance at $3361Breaking $3361 on the daily chart could lead to a strong rally toward $3451.
⚠ Watch for Bearish BreakdownIf price drops to $3306, a bearish wedge pattern would be confirmed, targeting the $3216–$3261 zone.
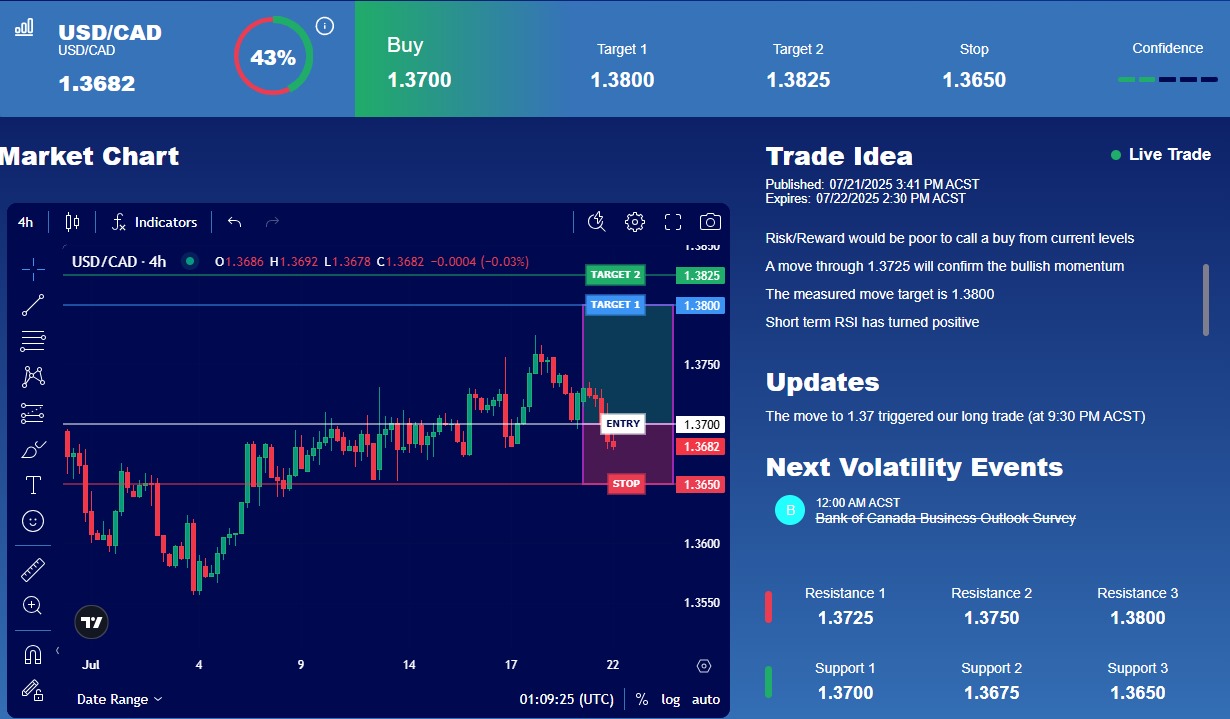
📌 Live Trade – USD/CAD📥 BUY : 1.3700
🎯 TP1: 1.3800🎯 TP2: 1.3825
▪ 🔓 SL Trail if in profit
🛡 Stop Loss: 1.3650💎 Market moving in our favor – manage your trade accordingly!
✍ TP targets are a bit extended — you’re free to exit earlier with smaller gains 💰.
Gold Pauses as Smart Money Signals High Pullback Risk 💡📉
Gold’s rally has paused, and the Smart Money Indicator suggests a higher risk of pullback.
📌 Since Monday’s U.S. session, spot gold has tested the $3400 resistance twice without success, now entering sideways movement near the highs.
🧭 On the 1-hour chart, the Smart Money Indicator shows resistance from order blocks between $3393.5 and $3402.6, potentially limiting upside in the short term.
⚠ Unless gold reclaims above $3391.5, downside risk remains elevated.🛡 A support zone between $3345–3350 has formed from prior orders — if price retests but doesn’t break below, it may act as a bullish entry signal.
📌 For reference only — not financial advice.
📈 Gold on the Rise?
🔸 If gold holds above the key level of $3402, bulls may continue to gain momentum!🔸 Volume is building at higher levels, showing strong buyer interest.🔸 $3402 is a crucial support – staying above it opens the door to these targets:🎯 $3440–3450, $3470, $3500
🛡 Supports: $3402, $3384, $3370
✨ If the market holds here, gold may be set to test new highs again!
📝 (This analysis is for informational purposes only and not financial advice.)
#Gold #XAUUSD #GoldAnalysis #Forex #Commodities #TechnicalAnalysis #TradingSignals #MarketOutlook #goldprice #Jin10Data 📊💰🔥