


Advertisement
USD/JPY

Aug 26, 2014からメンバー
23 投稿
Apr 08, 2016 at 07:07
it may be down to 107 level but surely will back up test 110 before testing 100 .
I start buy right now and TP at 110 before heavy sell to 100 .
Good luck .
I start buy right now and TP at 110 before heavy sell to 100 .
Good luck .

Mar 28, 2016からメンバー
94 投稿
Apr 08, 2016 at 07:12
The USDJPY continued its bearish momentum yesterday bottomed at 107.66 but traded higher earlier today hit 108.83. The bias remains bearish in nearest term testing 107.00 region. Immediate resistance is seen around 109.15/30. A clear break above that area could lead price to neutral zone in nearest term but as long as stays below 110.96 I still prefer a bearish scenario at this phase and any upside pullback should be seen as a good opportunity to sell.

Sep 28, 2015からメンバー
34 投稿
Apr 09, 2016 at 06:07
Last time USD/JPY short time upside rally rejected at 109.90 & also passing the key support (also intraday support ) 108.50. It heading towards 107.66 range. The downside pressure still very going on as there is not yet any strong indication of intervention from Japanese Government & Fed also not in way to push up dollar yet. In this scenario if clear pass 107.66 then it might lead to the downside target at 106.60 near the historical support at 106.50. If USD/JPY push further then look at 104.64 - 105.88 range. It might stabilize at 105.88 range if it sell off further and no intervention case.
Sep 28, 2015からメンバー
34 投稿
Apr 10, 2016 at 03:51
Next week there are key events but it might not be a quick remarkable reversal. Main focus is on China GDP q/y. If it positive it will boost dollar. A contrary move above 109.30 & 110.90 resistance areas are first warning signs. Its move to 107.66 will indicate whether downside major levels can hit or not.

Sep 28, 2015からメンバー
34 投稿
Apr 11, 2016 at 09:46
(編集済みのApr 11, 2016 at 09:47)
This morning post Tokyo session it hits a new trend low at 107.62 as we know that. After that there were some verbal threats from Japanese side. It's like they are very frustrated to see as it tries to break through that level. There are not yet any obvious strong reaction yet against the overall trend. Since the move is overextended so much as we understand so need caution also.
At 4 hour chart a harami forms giving some break and price still struggles to break above 5 & 8 EMA resistance.
As long price under 107.60 stronger the bearish bias as well as key break of 107.50.
At 4 hour chart a harami forms giving some break and price still struggles to break above 5 & 8 EMA resistance.
As long price under 107.60 stronger the bearish bias as well as key break of 107.50.
Sep 14, 2015からメンバー
4 投稿
Apr 13, 2016 at 06:13
Got in at 107.897, letting it ride.
Sep 14, 2015からメンバー
4 投稿
Apr 16, 2016 at 18:35
csc2009 posted:
Downward pressure remains, next immediate support level can be found around 118.50 zone, break below would lead to further decline.
Its not going anywhere near that area, its going to rise back up to mid 109 - mid 110 area then drop back down

Oct 02, 2014からメンバー
905 投稿
Apr 17, 2016 at 19:34
Kind of recovered last week.
Positivity

Apr 29, 2016 at 06:28
Fed interest rate yesterday lead the usdjpy back to downtrend moves its probably will lead to test again the lower sides and even lower ,we can see there is more room for going down follows strong moves by the expectation,
don't surprise if we will see usdjpy going lower over the last lows, if usdjpy will find support on 106.70 so it can be a good point to test some long but if it will not we need to expect even stronger moves the lower side for downtrend for 104 area
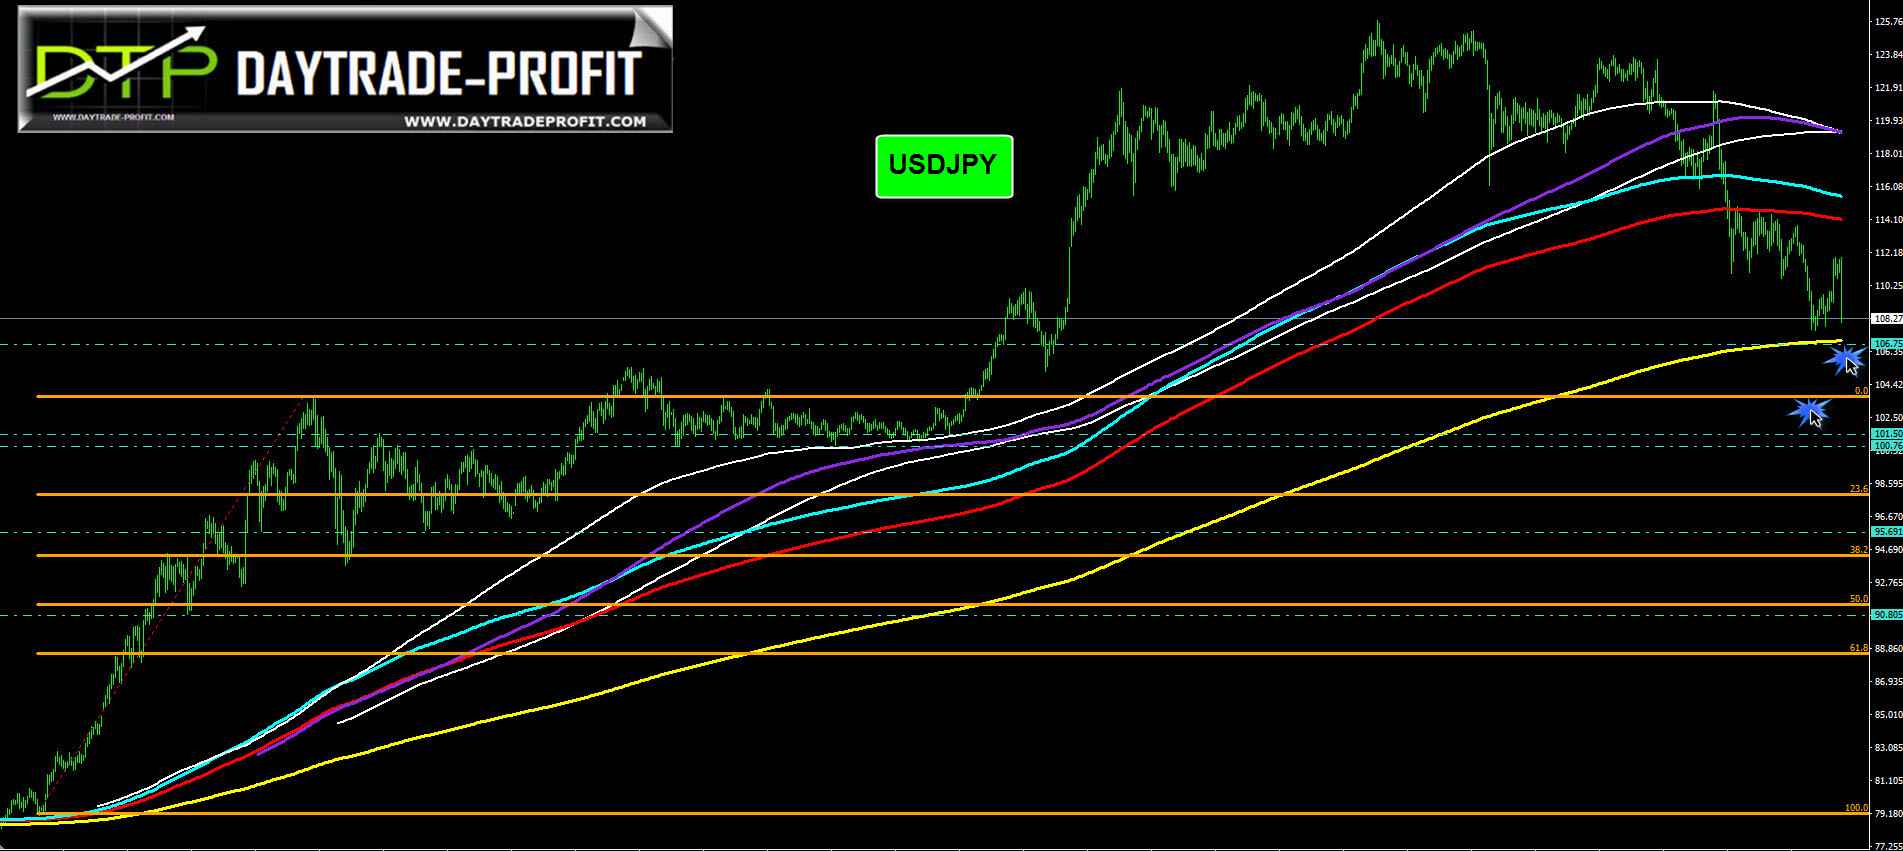
don't surprise if we will see usdjpy going lower over the last lows, if usdjpy will find support on 106.70 so it can be a good point to test some long but if it will not we need to expect even stronger moves the lower side for downtrend for 104 area
付属品:
Oct 02, 2014からメンバー
905 投稿
Apr 30, 2016 at 15:06
Interesting move last week!
Positivity


