


Advertisement
KeltnerPRO - Jared (による keltnerpro )
| 増加 : | +5645.75% |
| ドローダウン | 58.74% |
| ピップス: | 4744.8 |
| 取引 | 1003 |
| 勝利: |
|
| 負け: |
|
| タイプ: | リアル |
| レバレッジ: | 1:100 |
| 取引: | 不明 |
KeltnerPRO - Jared 討論


Nov 08, 2016 at 12:06
InsiderBCN posted:
Anyone can share their experience with that system?
Hi you can search in myfxbook with key word "Keltner" and you will find several cases
(big part of them with Keltner Pro).
My personal experience is positive with around 43% in 9 months.
Keltner Pro is a key part of my forex strategy and I'm happy with it.
The DD is increasing and trading frequency is reducing (I don't like that).
Having a precise idea about when to stop the EA I don't care and in the worst
case I will temporary stop. Indeedly on October 7 very bad situation with unexpected
loss.
Cheers
Find an edge and trade it
Nov 29, 2016 at 08:09
By go through history test with tds, I find the 2 critical elements to make this ea successful are:
1. its winning rate is around 48%-53%
2. its rr ratio is about 1.4-1.6
now here is my question, the winning rate will be lower if we setup maxopenposition=1(usually 5% lower than we setup maxopenposition=3), so it looks like the second and third trades average up the overall winning rate. Is that possible we can get higher winning rate if we skip the first trade and just open second and third trades?
Dec 12, 2016 at 12:23
Im writing about my experiences, so yours can be different ;)
Feb 09, 2017 at 07:55
keltnerpro posted:
Because I have plenty of other accounts not shown, this is my re-investment account used for proof and used to build up a nest egg
for the future.
What is the minimun deposit recomended for this EA...?... And broker,,,?...
Thanks.

forex_trader_405298
Feb 21, 2017からメンバー
4 投稿
Feb 22, 2017 at 08:04
besttools posted:
Drawdown: 58.74% is big risk...
And you Withdrawals: $0.00 !!!!!!
you use free demo bonus deposit !!!!!!!!! LOL

Jan 02, 2015からメンバー
13 投稿
Apr 13, 2017 at 06:48
Gebbe posted:besttools posted:
Drawdown: 58.74% is big risk...
And you Withdrawals: $0.00 !!!!!!
you use free demo bonus deposit !!!!!!!!! LOL
big return as well.
High risk strategy is thousand times better than low risk.
You have to just withdraw capital (50%) every year.
Plan Your Trade. Trade Your Plan.
Mar 12, 2013からメンバー
4 投稿
Apr 16, 2017 at 07:26
Hi, keltnerpro.
Why no trade from 02.17.2017 to now? what is wrong with the EA of KeltnerPRO?
Why no trade from 02.17.2017 to now? what is wrong with the EA of KeltnerPRO?


Jun 27, 2017 at 06:29
Issues of volatility can be ironed out by implementing 3 simple things:
1) Only allowing 1 trade per pair at a time
2) Keeping to fixed lots and only increase lots (manually) at new equity highs
3) Adding more currency pairs and at different time frames
To continue making this EA work smoothly (as is the case for me) - I've added/modified the following pairs/timeframes (they've all been backtested):
AUDUSD M5,
EURGBP H1,
EURUSD M15, EURUSD M30,
GBPUSD M5, GBPUSD M15,
NZDUSD M15,
USDCHF M5, USDCHF M15
USDJPY M15
Lot sizing will need to be re-adjusted as well as there are duplicate pairs (i.e. EURUSD, GBPUSD, and USDCHF) plus they all perform at different frequencies and profitabilities, historically speaking (this is optional).
For a $10k start balance, lot sizes could be:
AUDUSD = 0.12
EURGBP = 0.12
EURUSD = 0.02 (0.02*2=0.04)
GBPUSD = 0.02 (0.02*2=0.04)
NZDUSD = 0.12
USDCHF = 0.02 (0.02*2=0.04)
USDJPY = 0.12
Of course, one could just stick to the standard fixed 0.01 lot per $1k rule to keep things simple.
*Note: there's probably a few more timeframes / currency pairs that could work to create a great combo (i.e. H1 timeframe, SGD currency pair). You'll need to perform your own backtests to check if they are satisfactory to your preferences.
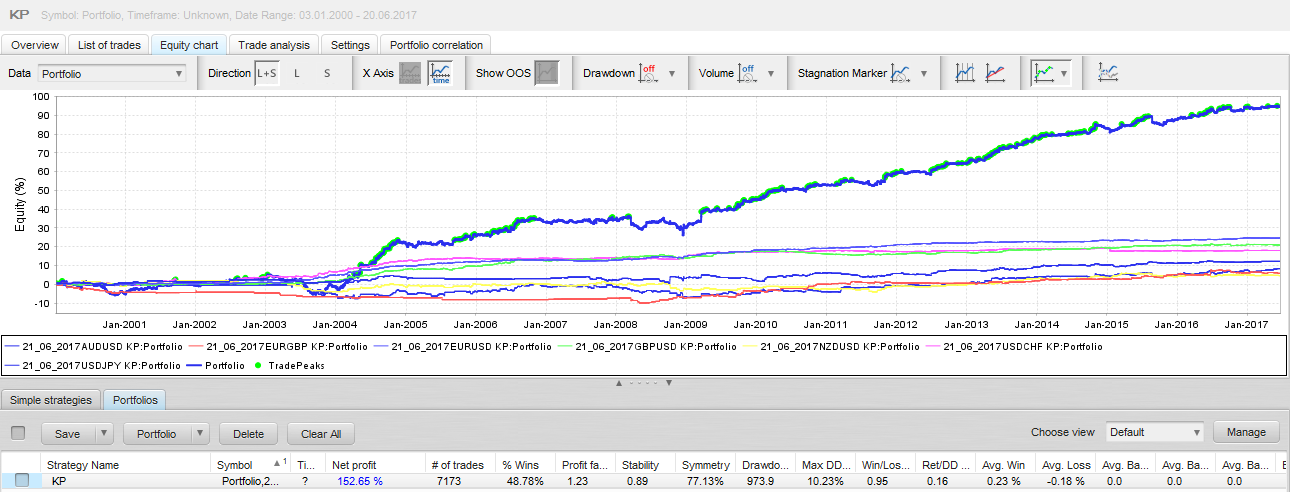
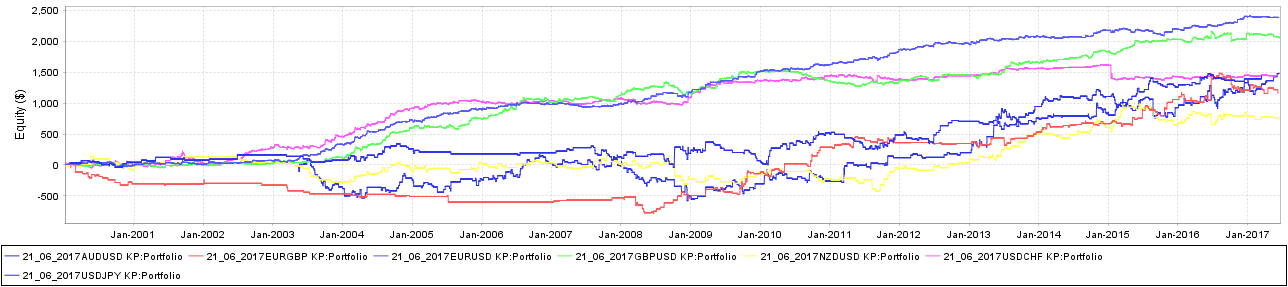
Here's a portfolio backtest (max drawdown hovers around ~10%):
1) Only allowing 1 trade per pair at a time
2) Keeping to fixed lots and only increase lots (manually) at new equity highs
3) Adding more currency pairs and at different time frames
To continue making this EA work smoothly (as is the case for me) - I've added/modified the following pairs/timeframes (they've all been backtested):
AUDUSD M5,
EURGBP H1,
EURUSD M15, EURUSD M30,
GBPUSD M5, GBPUSD M15,
NZDUSD M15,
USDCHF M5, USDCHF M15
USDJPY M15
Lot sizing will need to be re-adjusted as well as there are duplicate pairs (i.e. EURUSD, GBPUSD, and USDCHF) plus they all perform at different frequencies and profitabilities, historically speaking (this is optional).
For a $10k start balance, lot sizes could be:
AUDUSD = 0.12
EURGBP = 0.12
EURUSD = 0.02 (0.02*2=0.04)
GBPUSD = 0.02 (0.02*2=0.04)
NZDUSD = 0.12
USDCHF = 0.02 (0.02*2=0.04)
USDJPY = 0.12
Of course, one could just stick to the standard fixed 0.01 lot per $1k rule to keep things simple.
*Note: there's probably a few more timeframes / currency pairs that could work to create a great combo (i.e. H1 timeframe, SGD currency pair). You'll need to perform your own backtests to check if they are satisfactory to your preferences.
Here's a portfolio backtest (max drawdown hovers around ~10%):
付属品:
- TimeWarp to 2030 AD -
Dec 04, 2010からメンバー
1447 投稿
Jul 06, 2017 at 09:46
vocasla posted:
Issues of volatility can be ironed out by implementing 3 simple things:
1) Only allowing 1 trade per pair at a time
2) Keeping to fixed lots and only increase lots (manually) at new equity highs
3) Adding more currency pairs and at different time frames
To continue making this EA work smoothly (as is the case for me) - I've added/modified the following pairs/timeframes (they've all been backtested):
AUDUSD M5,
EURGBP H1,
EURUSD M15, EURUSD M30,
GBPUSD M5, GBPUSD M15,
NZDUSD M15,
USDCHF M5, USDCHF M15
USDJPY M15
Lot sizing will need to be re-adjusted as well as there are duplicate pairs (i.e. EURUSD, GBPUSD, and USDCHF) plus they all perform at different frequencies and profitabilities, historically speaking (this is optional).
For a $10k start balance, lot sizes could be:
AUDUSD = 0.12
EURGBP = 0.12
EURUSD = 0.02 (0.02*2=0.04)
GBPUSD = 0.02 (0.02*2=0.04)
NZDUSD = 0.12
USDCHF = 0.02 (0.02*2=0.04)
USDJPY = 0.12
Of course, one could just stick to the standard fixed 0.01 lot per $1k rule to keep things simple.
*Note: there's probably a few more timeframes / currency pairs that could work to create a great combo (i.e. H1 timeframe, SGD currency pair). You'll need to perform your own backtests to check if they are satisfactory to your preferences.
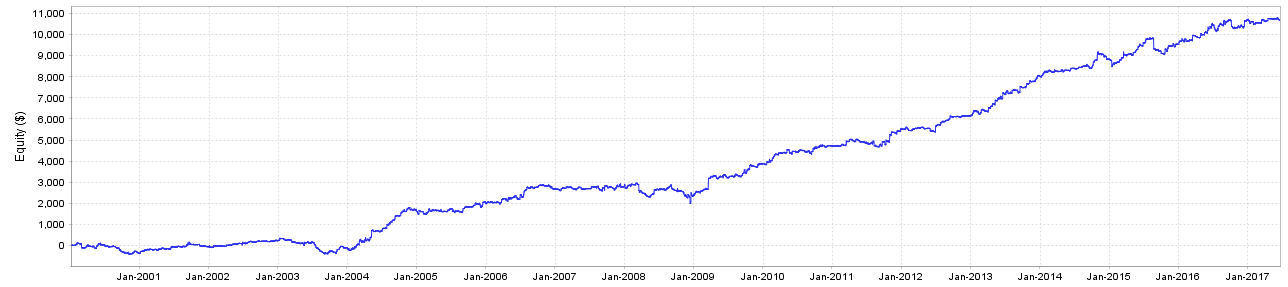
Here's a portfolio backtest (max drawdown hovers around ~10%):
https://www.myfxbook.com/files/vocasla/KP_2017__portfolio.png
Am I reading these results right, 152% return over a 16 year period with 10% max drawdown. This seems like a very low return for such a long backtest?

May 20, 2011からメンバー
694 投稿
Jul 06, 2017 at 19:21
aeronthomas posted:i dunno seems pretty good to me. Not many investments can achieve such great of a return with such low risk,vocasla posted:
Issues of volatility can be ironed out by implementing 3 simple things:
1) Only allowing 1 trade per pair at a time
2) Keeping to fixed lots and only increase lots (manually) at new equity highs
3) Adding more currency pairs and at different time frames
To continue making this EA work smoothly (as is the case for me) - I've added/modified the following pairs/timeframes (they've all been backtested):
AUDUSD M5,
EURGBP H1,
EURUSD M15, EURUSD M30,
GBPUSD M5, GBPUSD M15,
NZDUSD M15,
USDCHF M5, USDCHF M15
USDJPY M15
Lot sizing will need to be re-adjusted as well as there are duplicate pairs (i.e. EURUSD, GBPUSD, and USDCHF) plus they all perform at different frequencies and profitabilities, historically speaking (this is optional).
For a $10k start balance, lot sizes could be:
AUDUSD = 0.12
EURGBP = 0.12
EURUSD = 0.02 (0.02*2=0.04)
GBPUSD = 0.02 (0.02*2=0.04)
NZDUSD = 0.12
USDCHF = 0.02 (0.02*2=0.04)
USDJPY = 0.12
Of course, one could just stick to the standard fixed 0.01 lot per $1k rule to keep things simple.
*Note: there's probably a few more timeframes / currency pairs that could work to create a great combo (i.e. H1 timeframe, SGD currency pair). You'll need to perform your own backtests to check if they are satisfactory to your preferences.
Here's a portfolio backtest (max drawdown hovers around ~10%):
https://www.myfxbook.com/files/vocasla/KP_2017__portfolio.png
Am I reading these results right, 152% return over a 16 year period with 10% max drawdown. This seems like a very low return for such a long backtest?
Jul 07, 2017 at 05:57
aeronthomas posted:
Am I reading these results right, 152% return over a 16 year period with 10% max drawdown. This seems like a very low return for such a long backtest?
Leverage was set to fixed lot in order to show the underlying performance and minimize visual bias i.e. observe that the Stability factor = 0.89. With auto-lot function, the net gain in percent would be higher than that, with greater drawdown. I didn't show here the compound annual growth rate (CAGR).
Also note, I didn't do any analysis of winrate changes over time, either. So the statistical analysis above is fairly limited.
I merely wanted to show stability over time up to the present.
- TimeWarp to 2030 AD -
Dec 04, 2010からメンバー
1447 投稿
Jul 12, 2017 at 11:09
vocasla posted:Okay that explains it. Yes with compounding and increasing lot sizes it would be very interesting to see results.aeronthomas posted:
Am I reading these results right, 152% return over a 16 year period with 10% max drawdown. This seems like a very low return for such a long backtest?
Leverage was set to fixed lot in order to show the underlying performance and minimize visual bias i.e. observe that the Stability factor = 0.89. With auto-lot function, the net gain in percent would be higher than that, with greater drawdown. I didn't show here the compound annual growth rate (CAGR).
Also note, I didn't do any analysis of winrate changes over time, either. So the statistical analysis above is fairly limited.
I merely wanted to show stability over time up to the present.
Jul 26, 2017 at 14:36
This is the right picture of this EA: https://www.myfxbook.com/members/forexgermany/keltnerpro/983876
Thanks to the trader who is putting all results online...
Thanks to the trader who is putting all results online...
Im writing about my experiences, so yours can be different ;)
Nov 16, 2012からメンバー
18 投稿
Jul 28, 2017 at 19:49
thanks for share list of pairs etc, gbpusd looks very bad eurusd / usdchf in forexgermany looks better, Anyone can recommend good breakout from mql5?

May 03, 2016からメンバー
13 投稿
Jul 29, 2017 at 06:14
(編集済みのJul 29, 2017 at 06:22)
This is the statistics of the trading system
Total Pips count = 4774.8
Total Trade count = 1003
Total lots traded = 14,883.59
Ave lots per trade = 14.83 lots per trade (14,883.59/1003)
Ave pips gain per trade = 4.76 pips gain per trade (4774.8/1003 trades)
Ave pips gain per month = 132.63 (4774.8/3yrs = 1,591.6/12mths = 132.63)
Ave pips gain per day = 5.76 pips (23 trading days per month)
In another words, this system manage to gain on an average 5.76 pips per day using 14.83 lots size per trade. That sounds tremendously risky to me.
So if you can't find any other systems that can generate 5.76 pips daily and you are willing to risk 14.83 lot size per trade, then this system is well suited for you.
Don't just look at % returns to evaluate a system. I always look at the pips count 1st. No pips, mean no Profit. If a system isn't really good in generating pips count, it will always rely on risk (by increasing lot size) to boost income and thereby have impressive % returns.
There are basically 2 types of systems. Pips generating system vs Lot size boosting system.
Thus I always ask myself, is this system's winning formula based on good trading theory/concepts that enables it to keep generating pips after pips or is this system rely more on risk (lot size) to boost income.
I generally look for good pips generating system 1st and thereafter, increase my lot allocation once I found a systems that can generate good consistent pips returns. You only increase your lot size on a good stable system and not the other way, increase lot size in a risky system.
Sound Trading Theory = Good Profit


