Reklāma
Supply&Demand Price Action By The5ers Prop trading Fund

Biedrs kopš
108 ieraksti
Sep 09, 2019 at 11:56
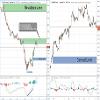
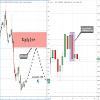
A Confluence of MACD Divergence and Pinbar Candlestick.
Monday 09/09/2019
Pinbar candlestick is one of the most reliable candles in the Forex charts.
It is a reversal candlestick signal.
The unique structure of this candle includes a long candlewick, at the opposite side a small candlewick, and a small body.
The long candlewick should be at least 2/3 of the entire candle.
The most reliable Pinbars are the ones that formed after a significant trend.
Last month’s candle in EUR/GBP ended as a Pinbar candlestick.
Pinbar candlestick in MN (monthly) chart is very rare.
In addition, we can see a significant MACD divergence in the MN chart.
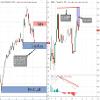
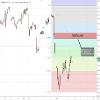
In the D1 time frame chart, we should for the right setup to sell EUR/GBP.
I’ll wait for one of these two situations to happen.
1 – If the price will breakout the demand below it indicates the price on its way to reaching the demand at the bottom.
In that case, I’ll look for price action setup for a sell position.
2 – If the price will reach the supply above, I’ll sell there at the first touch of the price.
The target in both cases will be the demand at the bottom.
Monday 09/09/2019
Pinbar candlestick is one of the most reliable candles in the Forex charts.
It is a reversal candlestick signal.
The unique structure of this candle includes a long candlewick, at the opposite side a small candlewick, and a small body.
The long candlewick should be at least 2/3 of the entire candle.
The most reliable Pinbars are the ones that formed after a significant trend.
Last month’s candle in EUR/GBP ended as a Pinbar candlestick.
Pinbar candlestick in MN (monthly) chart is very rare.
In addition, we can see a significant MACD divergence in the MN chart.
In the D1 time frame chart, we should for the right setup to sell EUR/GBP.
I’ll wait for one of these two situations to happen.
1 – If the price will breakout the demand below it indicates the price on its way to reaching the demand at the bottom.
In that case, I’ll look for price action setup for a sell position.
2 – If the price will reach the supply above, I’ll sell there at the first touch of the price.
The target in both cases will be the demand at the bottom.
Pielikumi
We fund the top 5% forex traders

Biedrs kopš
30 ieraksti
Sep 10, 2019 at 09:10
5ers? gilben?
Discipline with your trading plan!
Biedrs kopš
108 ieraksti
Sep 16, 2019 at 12:44
WTI Reaches a New 4 Month High After Saudi Arabia Oil Field Attacks.
Monday 16/09/2019
WTI price opens this trading week with a huge gap up.
The price ended last week at 55.00 zones and open this week at 60.00.
The highest level the price reach since the market opened is 63.00 zones which is a new high record for the past 4 months.
The reason for this Gap up is the brutal attack on Saudi Arabia oil fields.
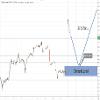
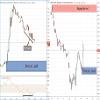
From the technical analysis perspective, the Gap up creates a fresh demand.
This demand is a great level to buy WTI and join the bullish momentum.
It seems there are many unfilled orders waiting for the price to come back to this level.
I’ll buy WTI at this demand and the first target will be 65.00 zones.
The final target for this buy position will be 73.00 zones.
BTW – if the price will break out the demand below it indicates the price on its way to reaching 45.00 zones.
Monday 16/09/2019
WTI price opens this trading week with a huge gap up.
The price ended last week at 55.00 zones and open this week at 60.00.
The highest level the price reach since the market opened is 63.00 zones which is a new high record for the past 4 months.
The reason for this Gap up is the brutal attack on Saudi Arabia oil fields.
From the technical analysis perspective, the Gap up creates a fresh demand.
This demand is a great level to buy WTI and join the bullish momentum.
It seems there are many unfilled orders waiting for the price to come back to this level.
I’ll buy WTI at this demand and the first target will be 65.00 zones.
The final target for this buy position will be 73.00 zones.
BTW – if the price will break out the demand below it indicates the price on its way to reaching 45.00 zones.
Pielikumi
We fund the top 5% forex traders

Biedrs kopš
2 ieraksti
Sep 18, 2019 at 02:26
Your Zone for EURGBP Didn't work
superswingtradr
Biedrs kopš
108 ieraksti
Sep 25, 2019 at 13:54
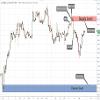
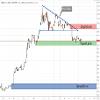
The price has performed a double bottom pattern on the D1 chart,
Also, while the price created the double bottom the MACD created a higher low, which's called MACD divergence.
The combination of double bottom and MACD divergence creates a great setup for buy position.
If the price will break the resistance above I'll look for a buy signal,
If the price will move down toward the demand below I'll buy at the demand,
For both options, the target will be the resistance at the top
Pielikumi
We fund the top 5% forex traders
Biedrs kopš
108 ieraksti
Oct 04, 2019 at 08:07
XAU/USD – Key Levels For Swing Forex Traders
For the swingers among us, we can see the XAU/USD is bearish .
For now, the price is between two Quasimodo levels.
Quasimodo pattern is one of the most powerful reversal patterns.
The supply above is a bearish QUASIMODO pattern and a great level for sell position.
The demand below is a bullish Quasimodo pattern and a great level to buy XAU/USD .
Pielikumi
We fund the top 5% forex traders
Biedrs kopš
108 ieraksti
Oct 06, 2019 at 10:35
USD/CAD price performed a symmetrical triangle pattern on the Monthly chart.
The price range becomes very tight, it seems that very soon the price will have to pick a direction and to break the pattern.
It is very rare to find a triangle pattern on the monthly chart,
If the price will break the pattern toward up I'll look for a price action setup to buy USD/CAD .
If the price will break down the pattern I'll look for a price action setup to sell USD/CAD .
The demand below on the monthly chart is the target for the sell position,
The supply above is the target for the buy position.
The demand below on the daily chart is still inside the pattern and therefore it riskier to trade it, but it's still a level with potential
For good trade.
This is a long term analysis for the USD/CAD .
Pielikumi
We fund the top 5% forex traders
Biedrs kopš
108 ieraksti
Oct 08, 2019 at 11:49
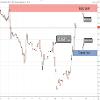
On the D1 chart, we can see how the price performed a descending triangle pattern,
The bottom line of this triangle has broken out two weeks ago by a new fresh supply created.
this supply is a great level to sell BTC/USD as a long term continuation trade,
The demand at the bottom will be the target.
The bottom line of this triangle has broken out two weeks ago by a new fresh supply created.
this supply is a great level to sell BTC/USD as a long term continuation trade,
The demand at the bottom will be the target.
Pielikumi
We fund the top 5% forex traders
Biedrs kopš
108 ieraksti
Oct 10, 2019 at 12:52
A Confluence of Fresh Supply and Fibonacci 61.8% Level.
Thursday 10/10/2019
In the H1 time frame chart, the DAX index seems to be bullish.
But in the higher time frame, we can see that the price has just become bearish,
This means that the uptrend we see at the H1 chart is only a technical correction for the higher time frame.
Among all the majors Indicies on the world stock markets, the DAX seems to be the weakest one,
Therefore, I’ll look for a signal and the right level to sell the DAX index.
The supply above seems like a fresh one, we can see how the price has a gap down from that level,
That indicates a massive sell order at that level and most likely some unfilled orders that are still waiting there for the price.
In addition, this fresh supply is also the Fibonacci 61.8% retracement of the last drop from 12.500 to 11.880 points.
The Fibonacci tool is a great one, but it’s not enough and it might not be smart to rely on Fibonacci retracement levels alone,
But, when Fibonacci levels confluence with a fresh supply it’s a great setup for a trade.
As we can see the supply above the confluence with Fibonacci 61.8% creates a powerful setup to sell the DAX Index.
I’ll sell at the first touch of the price at that level.
The final target for this sell position will be 11.700 zones.
Pielikumi
We fund the top 5% forex traders
Biedrs kopš
108 ieraksti
Oct 14, 2019 at 15:24
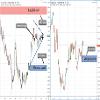
Combination of CCI Divergence and Fresh Demand.
Monday 14/10/2019
GBP/JPY has a significant rally of about 700 pips in the last few days.
For the long term, it seems the GBP/JPY price has changed the momentum from bearish to bullish.
The price reached a new high for the past 3 months.
So for the long term forex traders, I’ll recommend looking for a buy position.
In the M30 chart, we can see a fresh demand below which can be the first level to look for buy position.
Also, we can how the price move down and creates a lower low while the CCI indicator creates a higher low.
Between all indicators, CCI is one of the most effective indicator to look for divergence and use it.
The meaning of this divergence is that the existing trend is running out of power.
Therefore, I’ll look to buy at the demand below in the M30 chart.
If the price will breakout this demand I’ll look again to buy at the lower demand which we can see on the D1 chart.
The target for both options is the supply above which we also can see on the D1 chart at 144.00 zones.
It’s also a great fresh supply to look for sell on GBP/JPY.
This analysis is referred to the long term forex traders.
Pielikumi
We fund the top 5% forex traders
Biedrs kopš
108 ieraksti
Oct 24, 2019 at 07:44
BTC/USD price is in bearish momentum.
The current support is holding the price for the last three weeks.
If the price will break this support I'll look for a price action setup for sell position.
If the price will move up to the supply above I'll sell there at the first touch.
The current support is holding the price for the last three weeks.
If the price will break this support I'll look for a price action setup for sell position.
If the price will move up to the supply above I'll sell there at the first touch.
Pielikumi
We fund the top 5% forex traders

forex_trader_745947
Biedrs kopš
54 ieraksti
Oct 26, 2019 at 22:09
How indicators know about supply and demand ?
Thanks
Thanks
Biedrs kopš
108 ieraksti
Nov 03, 2019 at 13:40
USOIL price is between two critical levels which are great for day trading.
The demand below seems like a great level for buy position and the supply above seems like a great level for sell position.
We should be aware of the OPEC outlook released on Tuesday.
The demand below seems like a great level for buy position and the supply above seems like a great level for sell position.
We should be aware of the OPEC outlook released on Tuesday.
Pielikumi
We fund the top 5% forex traders

Biedrs kopš
3 ieraksti
Nov 05, 2019 at 08:26
Hello,
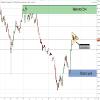
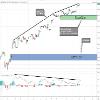
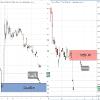
I use Supply&Demand and Price Action too. But I rather use bigger timeframes. This is some of my pics and all the orders played out.
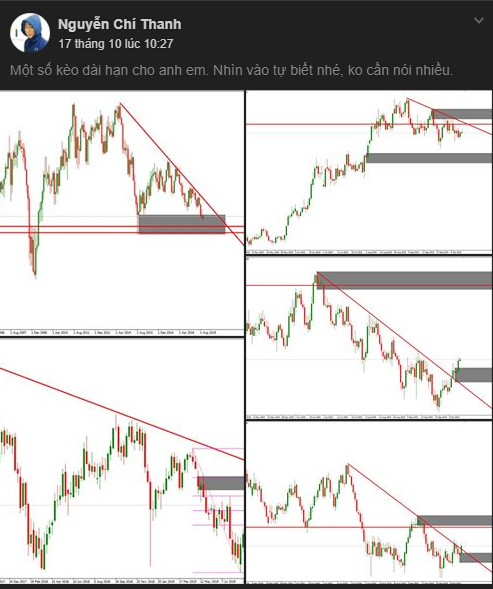
I use Supply&Demand and Price Action too. But I rather use bigger timeframes. This is some of my pics and all the orders played out.
Biedrs kopš
108 ieraksti
Nov 11, 2019 at 13:04
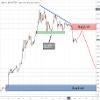
As we can see in the D1 chart the price creating a symmetric triangle pattern .
If the price will breakout toward down it indicates the price tends to reach the demand below and I'll look to sell.
If the price will break toward up I'll look to buy GBP/JPY .
If the price will breakout toward down it indicates the price tends to reach the demand below and I'll look to sell.
If the price will break toward up I'll look to buy GBP/JPY .
Pielikumi
We fund the top 5% forex traders
Biedrs kopš
108 ieraksti
Nov 17, 2019 at 14:29
The SPX500 has reached a new record last week.
The price has a significant divergence with the MACD indicator which indicates for a reversal opportunity.
If the price will breakout the support below it will be the right signal to look for a price action setup to sell the SPX500 index.
The demand at the bottom will be the target for this position.
Pielikumi
We fund the top 5% forex traders
Biedrs kopš
108 ieraksti
Nov 21, 2019 at 13:12
The price is still bearish .
In the H4 chart, we can see the significant demand below which is a great level for long term buy position.
The target for this buy position will be 10.000 zones.
In the H1 chart, we can see a fresh supply above, as long as the price didn't touch the demand below I'll sell at the supply.
The target for this sell position will be the demand below.
Pielikumi
We fund the top 5% forex traders
Biedrs kopš
108 ieraksti
Nov 26, 2019 at 13:38
On the weekly chart, we can see how the candle from 2 weeks ago has ended as a bearish engulfing candlestick.
It indicates that the long term bearish momentum is still continuing.
On the H1 chart, we can see a fresh supply above which is a great level to sell and join the long term bearish momentum.
I'll sell at this supply and the target will be 1.0700 zones.
It indicates that the long term bearish momentum is still continuing.
On the H1 chart, we can see a fresh supply above which is a great level to sell and join the long term bearish momentum.
I'll sell at this supply and the target will be 1.0700 zones.
Pielikumi
We fund the top 5% forex traders

Biedrs kopš
1 ieraksti
Nov 27, 2019 at 07:19
Love your posts! S/D is one of the must-learn systems.