


Advertisement
EUR/USD

Tham gia từ Nov 06, 2014
28bài viết
Jun 12, 2015 at 16:39
rob559 posted:tchutchuco posted:
Hi all,
Is any one see what I see or I am wrong.
Possible pull back to 1.05 / 1.04 area.
[/quote
no i do not see that ,looking more 1.09 area
Thanks for the kindly reply back .... appreciated

Tham gia từ Jul 10, 2014
1114bài viết
Jun 12, 2015 at 16:54
EUR/USD consolidation continued today and I doubt anything will change before the market closes for the weekend. Next week the pair will likely test the resistance at 1.1440 again.

Tham gia từ Jun 08, 2014
413bài viết
Jun 12, 2015 at 18:57
EUR/USD fell sharply early today to 1.1151 then recovered to 1.1294 by the end of the day but currently trade near the opening price, Very tight move by the end of the week.
Tham gia từ Jun 08, 2014
454bài viết
Jun 12, 2015 at 19:31
I hit my target for today for EUR/USD at 1.1175 and now price is is back to the open price the market is indecisive. anyway drop or rise I have a feeling next week price will trade in good range.

Tham gia từ May 01, 2015
675bài viết
Jun 12, 2015 at 19:42
EUR recorded a decrease on Thursday after a downtrend throughout the day. The session starts at a price of 1.1323, then went down, reaching the lowest level for the day at 1.1183. Later reversed direction and the euro finished at 1.1257. In case the price continue to fall, the couple will move to the first support at 1.1051.
Tham gia từ Apr 09, 2014
832bài viết
Jun 12, 2015 at 21:01
Greek officials caught markets off-guard and announced a new set of proposals to be submitted over the weekend, but nothing is sure yet. Eur/Usd prices are close at daily open price, there is no liquidity today.

forex_trader_186239
Tham gia từ Apr 15, 2014
224bài viết
Jun 13, 2015 at 15:13
Volatility in EUR/USD is just coming
forex_trader_186239
Tham gia từ Apr 15, 2014
224bài viết
Jun 14, 2015 at 06:19
Nothing exepting volatility can be predicted in market, I think so

Tham gia từ Jun 07, 2011
372bài viết
Jun 14, 2015 at 06:20
The Euro fell after comments from German Chancellor that "a strong euro hampers the reforms in Spain and Ireland."
But the real effective exchange rate is at 2002 levels, when the EUR / USD is found to transact at around 0.90.
The balance expected for the current account of the euro area for this year is 2.6% of GDP, the opposite of a weak currency sign.
But the real effective exchange rate is at 2002 levels, when the EUR / USD is found to transact at around 0.90.
The balance expected for the current account of the euro area for this year is 2.6% of GDP, the opposite of a weak currency sign.
Tham gia từ Jun 08, 2014
454bài viết
Jun 14, 2015 at 10:24
EUR/USD the market closed on the opening price last week. it is going to be interesting how the market will react on Monday.

Tham gia từ Nov 11, 2013
20bài viết
Jun 14, 2015 at 12:50
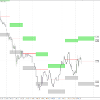
Let's use Derivatives OPTIONS AND FUTURES to analyse EUR!
The month began with the down movement but then the price returned into the upper half of the “Options corridor”. On the first attached image (daily EUR/USD chart) we can see a resistant on the Balance Line (1.12250).
I would like to repeat, that this Line as well as both green and gray zones are results of EUR Options trading on Chicago Exchange. Everything is based on real data and not on some questionable and subjective parameters.
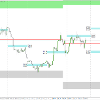
Anyway, this situation indicates an uptrend. But let’s not hurry. There is another FX-DERIVATIVE, which can help us. EURO FUTURES!!! Look at the second attached image. This is H4 EUR/USD chart.
I put some blue zones on the graph. Those zones indicate price levels where most of bad traders will have Margin Calls! That’s right! So the market makers can use that for their evil purposes. The data for those zones I also took from the CME website (http://www.cmegroup.com/).
Ok, so right now the price is between the Balance Line and the blue (let’s call it “Margin Zone”). Even thou we have the uptrend (because of the options), I would wait until the price will move above the Margin Zone (1.13122 - 1.13386). However on the level (1.14391 – 1.14127) there is another Margin Zone which actually is located on the maximum of the last month. Will there be a resistance?
To begin trading SHORT, the price will have to move below the Balance Line and below the lowest Margin Zone (1.11214 – 1.10950).
I made a separate topic about this method:
http://www.myfxbook.com/community/experienced-traders/fx-derivatives-for-spot-analysis/973437,1
Subscribe to it, if you are interested to learn more
The month began with the down movement but then the price returned into the upper half of the “Options corridor”. On the first attached image (daily EUR/USD chart) we can see a resistant on the Balance Line (1.12250).
I would like to repeat, that this Line as well as both green and gray zones are results of EUR Options trading on Chicago Exchange. Everything is based on real data and not on some questionable and subjective parameters.
Anyway, this situation indicates an uptrend. But let’s not hurry. There is another FX-DERIVATIVE, which can help us. EURO FUTURES!!! Look at the second attached image. This is H4 EUR/USD chart.
I put some blue zones on the graph. Those zones indicate price levels where most of bad traders will have Margin Calls! That’s right! So the market makers can use that for their evil purposes. The data for those zones I also took from the CME website (http://www.cmegroup.com/).
Ok, so right now the price is between the Balance Line and the blue (let’s call it “Margin Zone”). Even thou we have the uptrend (because of the options), I would wait until the price will move above the Margin Zone (1.13122 - 1.13386). However on the level (1.14391 – 1.14127) there is another Margin Zone which actually is located on the maximum of the last month. Will there be a resistance?
To begin trading SHORT, the price will have to move below the Balance Line and below the lowest Margin Zone (1.11214 – 1.10950).
I made a separate topic about this method:
http://www.myfxbook.com/community/experienced-traders/fx-derivatives-for-spot-analysis/973437,1
Subscribe to it, if you are interested to learn more
Đính kèm:
avoblikov@
forex_trader_186239
Tham gia từ Apr 15, 2014
224bài viết
Jun 14, 2015 at 12:52
Yes, we will see...
Tham gia từ Jun 09, 2015
13bài viết
Jun 15, 2015 at 07:17
I entered long with stop loss 1.114 and tp open above 1.13... I am long gbpusd with stop loss 1.55 and tp 1.57 and 1.60..

Tham gia từ Apr 08, 2014
1140bài viết
Jun 15, 2015 at 07:57
On Friday session the EURUSD initially fell but found enough buying pressure near the 1.1147 to turn around and managed to close in the green near the high of the day, creating a hammer pattern. The hammer pattern suggests that the currency might want to test again the 1.1391 area unless the Greek drama steps in.
"I trade to make money not to be right."

Tham gia từ Oct 02, 2014
905bài viết
Jun 15, 2015 at 10:14
Calm day for the eususd so far.
Positivity

Tham gia từ Oct 11, 2013
769bài viết
Jun 15, 2015 at 10:58
The EURUSD is still without a clear direction. It may go up or down, depending on how the fundamentals keep showing up.
Tham gia từ Jun 09, 2015
13bài viết
Jun 15, 2015 at 11:48
so far fundamentals and statements from European Leaders are against euro but there is something that keep on stabilizing euro.. Amazing..!!! I feel we can see upside again but if 1.114 remains...!!!
Tham gia từ Jun 07, 2011
372bài viết
Jun 15, 2015 at 12:50
EUR / USD opened today with a "gap" after reaching the resistance of 1.1300 on Friday.
There is a negative divergence between the short-term oscillators and the price.
The RSI is back below its 50 and MACD line below its signal line, just stay negative.
This "momentum" increases the possibility of further decreases.
There is a negative divergence between the short-term oscillators and the price.
The RSI is back below its 50 and MACD line below its signal line, just stay negative.
This "momentum" increases the possibility of further decreases.
Tham gia từ Oct 08, 2011
135bài viết
Jun 15, 2015 at 16:28
EUR/USD daily chart
the pair is currently in consolidation with 9 bars.
Use either high of the last 3 days and add 1 pip to the ask price and place a buy-stop order.
Place your SL 5 pips below the low of the reverse-hook, which is 1.1148 on our charts
Trade to above the last full correction on the weekly chart
which is 1.1533 on our charts.
"a little bit of knowledge is a dangerous thing"


