


Advertisement
EURUSD 4H
Mar 09, 2024 at 09:21
688 Views
8 Replies

Member Since Sep 01, 2022
24 posts
Mar 10, 2024 at 16:04
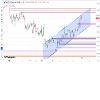
The EURUSD is currently in congestion on the monthly with 15 bars, including the March bar.
High of the congestion is 1.0929 and the low is 1.0482 (on my chart)
The rule is, not to trade more than 12.5 % above and below the entire spread of the high/low of the congestion, which is approx. 450 pips.
First bar to attempt to trade outside this price range is bar 17.
Best to stay inside the high and low of the congestion.
Use a faster timeframe to sell at the high of the congestion and buy at the low, to trade back into it until bar 17 starts
The high of the monthly congestion was reached on Friday and the close is still higher than the high of the congestion's measuring bar.
A hint: the March bar has barely 1 pip difference between open price and low. I call it a "hanger"
Hanger prices usually attract the trend to it. Not always right away, but keep in mind that this is the monthly chart.
A little bit of knowledge is a dangerous thing!
Member Since Sep 01, 2022
24 posts
Mar 14, 2024 at 13:52
As I have mentioned above, the EURUSD is in congestion on the monthly chart and currently at the high of the measuring bar. 1.0929
There is a legitimate entry on the daily chart, according to the chart laws, to sell at 1.0902 (minus 1 pip).
Current price is 1.0811
The exit would be the split between high and low of the measuring bar (see above)
There is a legitimate entry on the daily chart, according to the chart laws, to sell at 1.0902 (minus 1 pip).
Current price is 1.0811
The exit would be the split between high and low of the measuring bar (see above)
A little bit of knowledge is a dangerous thing!
Member Since Sep 01, 2022
24 posts
Mar 14, 2024 at 16:19
JTrading89 posted:
As I have mentioned above, the EURUSD is in congestion on the monthly chart and currently at the high of the measuring bar. 1.0929
There is a legitimate entry on the daily chart, according to the chart laws, to sell at 1.0902 (minus 1 pip).
Current price is 1.0811
The exit would be the split between high and low of the measuring bar (see above)
Correction, the current price was 1.0911
A little bit of knowledge is a dangerous thing!
Member Since Sep 01, 2022
24 posts
Mar 19, 2024 at 09:03
JTrading89 posted:JTrading89 posted:
As I have mentioned above, the EURUSD is in congestion on the monthly chart and currently at the high of the measuring bar. 1.0929
There is a legitimate entry on the daily chart, according to the chart laws, to sell at 1.0902 (minus 1 pip).
Current price is 1.0811
The exit would be the split between high and low of the measuring bar (see above)
Correction, the current price was 1.0911
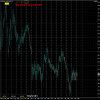
Prices slowly start breaking back into the congestion of the monthly chart. The congestion be seen on the attached chart.
As mentioned above, the current monthly bar is a "hanger", and the hanger price of the bar (the low of this month) attracts the trend, but prices have to be in congestion.
The SELL entry price on the daily chart was 1 pip below the low of March 12, which was 1.0902.
Attachments:
A little bit of knowledge is a dangerous thing!
Mar 21, 2024 at 16:11
JTrading89 posted:JTrading89 posted:JTrading89 posted:
As I have mentioned above, the EURUSD is in congestion on the monthly chart and currently at the high of the measuring bar. 1.0929
There is a legitimate entry on the daily chart, according to the chart laws, to sell at 1.0902 (minus 1 pip).
Current price is 1.0811
The exit would be the split between high and low of the measuring bar (see above)
Correction, the current price was 1.0911
Prices slowly start breaking back into the congestion of the monthly chart. The congestion be seen on the attached chart.
As mentioned above, the current monthly bar is a "hanger", and the hanger price of the bar (the low of this month) attracts the trend, but prices have to be in congestion.
The SELL entry price on the daily chart was 1 pip below the low of March 12, which was 1.0902.
Thanks
Member Since Sep 01, 2022
24 posts
Mar 22, 2024 at 12:29
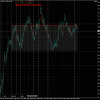
On Wednesday there was a typical "STOP RUNNING" action, performed by the "Market Makers" (Banks and Governments).
Prices went up to close to the high of the monthly congestion (1.0928), Thursday, prices went up a few pips above the congestion high, then went straight down to where they were on Tuesday this week, and today even lower.
Once the "RULES OF CONGESTION" are understood, it is just a matter of trusting this knowledge and stay in a trade (or get out and in again!)
the goal should be to exit near the center of the Measuring bar (MB - monthly), which is approx. 220 pips below the high of 1.0928.
The low of the MB-monthly is 1.0479 (on my chart)
Attachments:
A little bit of knowledge is a dangerous thing!
Member Since Sep 01, 2022
24 posts
Mar 22, 2024 at 12:49
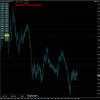
STOP RUNNING happens in congestion on long-term charts (day/week/month)
Almost impossible to spot when only one intraday chart is open.
Almost impossible to spot when only one intraday chart is open.
A little bit of knowledge is a dangerous thing!

*Commercial use and spam will not be tolerated, and may result in account termination.
Tip: Posting an image/youtube url will automatically embed it in your post!
Tip: Type the @ sign to auto complete a username participating in this discussion.


