


Advertisement
EUR/USD

Member Since Nov 12, 2010
160 posts
Feb 03, 2015 at 03:42
(edited Feb 03, 2015 at 03:42)
Well boys and girls, Australia's interest rate decision of a cut might be the start of the momentum we need to have EURUSD break out and head south again.
See my profile or message me for my latest EA

Feb 03, 2015 at 08:02
EUR / USD closed the week consolidating.
Remains below the falling trend line and in that trajectory.
The RSI (14 days) crossed above its 30 line, the daily MACD fell and is almost to cross its signal line.
Despite the possible short-term recovery, the price behavior indicates a downward long-term trend.
R3 - 1.14235
R2 - 1.13934
R1 - 1.13368
Daily Std. Pivot - 1.13067
S1 - 1.12501
S2 - 1.12200
S3 - 1.11634

forex_trader_187695
Member Since Apr 25, 2014
19 posts
Feb 03, 2015 at 08:06
Everyone is right, EURUSD is consolidating. Now i think everyone needs to wait before entering a trade. Maybe EURUSD will be bullish at Sydney Market Session close and London market open. Goodluck everyone and managed your account.
Member Since Apr 14, 2014
230 posts
Feb 03, 2015 at 08:08
Eur/usd continues to trade sideways, 1.1365 levels seems to be important resistance level. This pair managed to hold above 1.13 level yesterday, it may test 1.1365 level today
forex_trader_187695
Member Since Apr 25, 2014
19 posts
Feb 03, 2015 at 08:18
It's time to buy EURUSD now. It's bullish for me. Good luck everyone!
forex_trader_187695
Member Since Apr 25, 2014
19 posts
Feb 03, 2015 at 08:19
The trend is changing and now everyone put a stop loss if you are buying a EURUSD because it's looks like it's bearish trend now. I would recommend to sell it now

Member Since Apr 08, 2014
1140 posts
Feb 03, 2015 at 09:42
EURUSD has been sheltered in a tight range since announcing of ECB massive stimulus package. Later today, the EURUSD will get a chance to react to U.S data on Factory Orders.
"I trade to make money not to be right."
Member Since Nov 12, 2010
160 posts
Feb 03, 2015 at 11:36
SamuraiFXTrader posted:
It's time to buy EURUSD now. It's bullish for me. Good luck everyone!
SamuraiFXTrader posted:
The trend is changing and now everyone put a stop loss if you are buying a EURUSD because it's looks like it's bearish trend now. I would recommend to sell it now
So which is it Samurai???? You said Buy and Sell in a matter of minutes.
See my profile or message me for my latest EA
Member Since Nov 12, 2010
160 posts
Feb 03, 2015 at 13:22
Looks like we are going up, Buy Now would be my recommendation. Going to 1.16 at least I believe
See my profile or message me for my latest EA
Member Since Oct 08, 2011
135 posts
Feb 03, 2015 at 15:15
yesterday I provided 4 different (exact) buy-stop entry prices off the daily chart (major entry signals).
All have been filled by now.
It may be possible to stay in either one of the trades to near 1.1480, then start moving the SL according to sections on the 4-hr chart.
There may be a good chance to manage this trade all the way to near 1.1680, by moving the SL when a new section is built on the 4-hr chart.
This is the easiest way to manage a profitable trade - provided that the lot-size was calculated/selected properly.
If the lot size is wrong, then fear or greed may get in the way.
"a little bit of knowledge is a dangerous thing"
Feb 03, 2015 at 15:52
bestdarngood posted:SamuraiFXTrader posted:
It's time to buy EURUSD now. It's bullish for me. Good luck everyone!SamuraiFXTrader posted:
The trend is changing and now everyone put a stop loss if you are buying a EURUSD because it's looks like it's bearish trend now. I would recommend to sell it now
So which is it Samurai???? You said Buy and Sell in a matter of minutes.
He mentioned his opinion based on chart movement (I think he is speaking in short term). But if we look on long term, the pair is slightly bullish.

Member Since Jul 10, 2014
1114 posts
Feb 03, 2015 at 15:55
honeill posted:
EURUSD has been sheltered in a tight range since announcing of ECB massive stimulus package. Later today, the EURUSD will get a chance to react to U.S data on Factory Orders.
The pair did react and moved to the upside again. It looks like correction contiues. Next target is likely 1.1530.
forex_trader_187695
Member Since Apr 25, 2014
19 posts
Feb 03, 2015 at 16:04
bestdarngood posted:
Looks like we are going up, Buy Now would be my recommendation. Going to 1.16 at least I believe
I agree with you. Buy EURUSD now and Good luck everyone.
Member Since Jun 08, 2014
454 posts
Feb 03, 2015 at 17:31
Price made a good correction today and price is over the resistance level 1.1380 closing over the resistance will push the price higher.


Member Since Nov 11, 2012
253 posts
Feb 03, 2015 at 20:26
takechance posted:
Some good news from Greece finally.....will the EUR recover massively this week? Lets see.
So this one helped afterall??
antariks1@

forex_trader_202879
Member Since Aug 07, 2014
378 posts
Feb 03, 2015 at 20:41
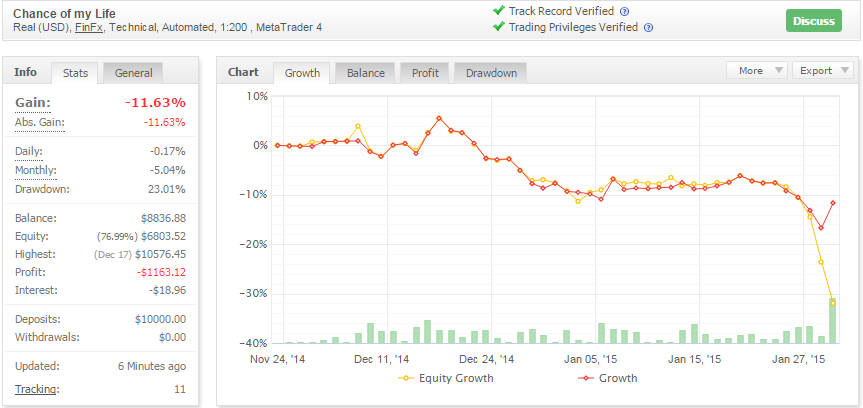
To bad this so called "Account manager" doesn't see what you guys are seeing.
http://www.myfxbook.com/members/CrazyTrader/chance-my-life/1090117
That one trade on EU alone has his drawdown well over 30% and counting. I guess he is willing to risk his clients entire account.
That is what happens when you allow demo traders to run your live account.
http://www.myfxbook.com/members/CrazyTrader/chance-my-life/1090117
That one trade on EU alone has his drawdown well over 30% and counting. I guess he is willing to risk his clients entire account.
That is what happens when you allow demo traders to run your live account.
Member Since Nov 12, 2010
160 posts
Feb 03, 2015 at 23:25
I'm currently back in a Sell Position, what is everyone else doing?
I believe we will go back down to 1.11 and lower. The US still has the better economy than the EU right now and I believe we will see further lows this year. Parity is still possible.
I believe we will go back down to 1.11 and lower. The US still has the better economy than the EU right now and I believe we will see further lows this year. Parity is still possible.
See my profile or message me for my latest EA
Member Since Nov 11, 2012
253 posts
Feb 04, 2015 at 03:14
(edited Feb 04, 2015 at 03:19)
Greece stock market was up 11%. Maybe some more good time ahead for EUR.
If the upmove sustains 1.1730-1.1750 is a high probable zone to reach.
If the upmove sustains 1.1730-1.1750 is a high probable zone to reach.
antariks1@


