


Advertisement
EUR/USD
Member Since Mar 15, 2017
8 posts
Apr 25, 2017 at 06:23
A major event like Le Pen coming French president! Unlikely but in this crazy world, it is risk that we have to take seriously

Apr 25, 2017 at 06:43
so at the end of the day tho, wat would be the guess to where the market would be heading too then??? up or down as atm im guessing after a massive jump on monday that the market i think would slowly start to go back down but atm im only guessing
dj_h63@

Member Since Apr 08, 2014
1140 posts
Apr 25, 2017 at 07:48
On yesterday session, the EURUSD opened with a massive gap up and fell with a wide range but found enough support at 1.0819 to trim half of its losses, closing in the middle of the daily range, in addition the currency pair managed to close above Friday’s high, which suggests a bullish momentum.
The currency pair is now trading above the 10, 50, and 200-day moving averages that should provide dynamic support.
The key levels to watch are: daily resistance 1.1097, key level at 1.0970 (resistance), the 200-day moving average at 1.0780 (support), a Fibonacci level at 1.07132 (support) and the 10-day moving average at 1.0712 (support).
"I trade to make money not to be right."

Apr 25, 2017 at 10:26
A calm has spread across the EUR markets on Tuesday, as the bulls continue to consolidate yesterday’s massive rally, keeping EUR/USD largely flat-lined in the familiar range near 1.0865/70 region.
EUR/USD Technical Levels:
Technical resistances for the pair are aligned at 1.0900/20 (round number/ multi-month tops), 1.0946/50 (Fib R2/ psychological levels) and finally 1.1000 (key resistance). On the flip side, the spot finds next support at 1.0811 (5-DMA), a break below that level could open the door to 1.0757 (classic S2/ Fib S3) and 1.0736 (10-DMA).
Trend Index:
Bearish

Member Since Jul 10, 2014
1114 posts
Apr 25, 2017 at 13:08
EUR/USD formed a spinning top candlestick on the one-hour time-frame at 1.0900 and there will likely be a move to the downside towards 1.0850 again, but the sideways consolidation continues for now.

Member Since Sep 12, 2015
1933 posts
Apr 25, 2017 at 15:04
090 ceiling has become a floor for now , some retests of this level if we get a pull back
"They mistook leverage with genius".

Member Since Feb 22, 2015
174 posts
Apr 26, 2017 at 04:49
Central bankers pushing EUR/USD past 1.09, it looks like it's heading up to 1.10 area soon. I think the Bull is bluffing.
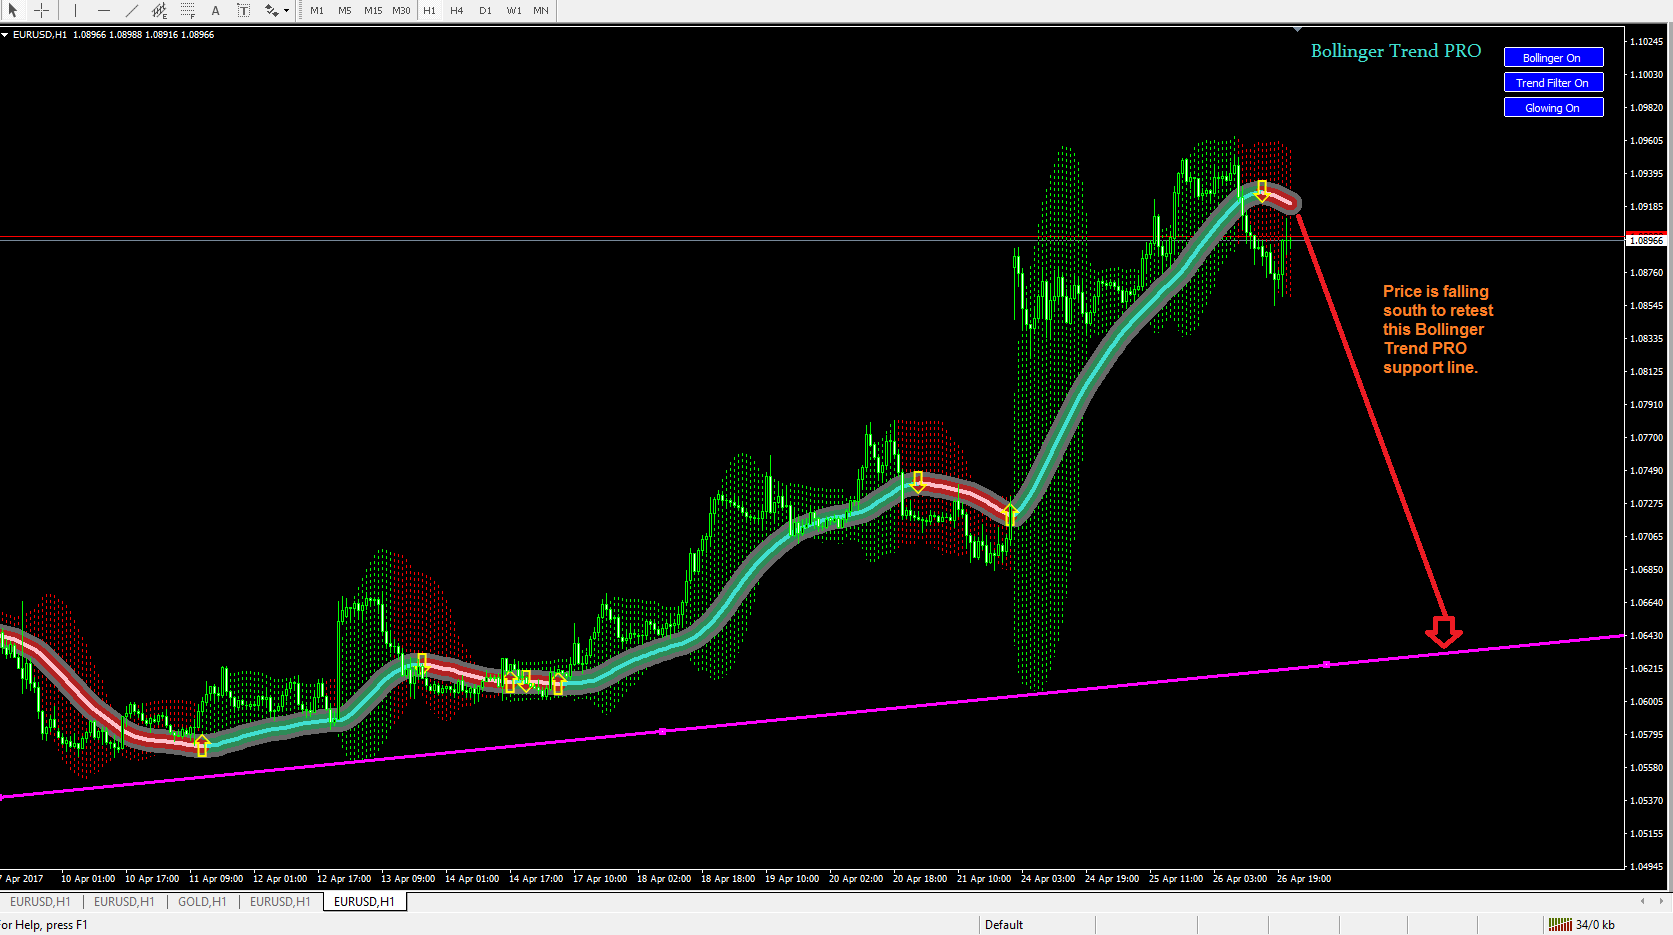
I trade Forex using my Bollinger Trend PRO mt4 indicator.
Member Since Apr 08, 2014
1140 posts
Apr 26, 2017 at 07:24
On yesterday session, the EURUSD rallied with a wide range and closed near the high of the day, in addition the currency pair managed to close above Monday’s high, which suggests a strong bullish momentum.
The currency pair is now trading above the 10, 50, and 200-day moving averages that should provide dynamic support.
The key levels to watch are: daily resistance 1.1097, key level at 1.0970 (resistance), the 200-day moving average at 1.0778 (support), the 10-day moving average at 1.0743 (support) and a Fibonacci level at 1.07132 (support).
"I trade to make money not to be right."
Member Since Jul 10, 2014
1114 posts
Apr 26, 2017 at 13:00
EUR/USD continued moving to the upside and reached a high at 1.0950, but it appears that move to the upside is over for now. The pair formed a double top at that same level on the one-hour time-frame and started dropping. Next target is likely the support at 1.0850 which is the (MA)89 indicator on the one-hour time-frame.
Member Since Feb 22, 2015
174 posts
Apr 26, 2017 at 19:26
Cryptocurrency posted:
Central bankers pushing EUR/USD past 1.09, it looks like it's heading up to 1.10 area soon. I think the Bull is bluffing.
It seems like bankers don't want to spend anymore money to continue their Bull bluff. Price is heading south to retest that Bollinger Trend PRO support line.
Attachments:
I trade Forex using my Bollinger Trend PRO mt4 indicator.
Member Since Apr 08, 2014
1140 posts
Apr 27, 2017 at 07:51
On yesterday session, the EURUSD went back and forward without any clear direction but closed in the red, in the middle of the daily range, in addition closed within Tuesday’s range, which suggests being clearly neutral, neither side is showing control.
The currency pair is now trading above the 10, 50, and 200-day moving averages that should provide dynamic support.
The key levels to watch are: daily resistance 1.1097, key level at 1.0970 (resistance), a daily support at 1.0900, the 200-day moving average at 1.0777 (support), and the 10-day moving average at 1.0773 (support).
"I trade to make money not to be right."
Member Since Jul 10, 2014
1114 posts
Apr 27, 2017 at 13:53
EUR/USD dropped sharply after the ECB press conference earlier today and is now testing the support at 1.0850. If it breaks out below that support it could reach 1.0800 again.
Apr 27, 2017 at 16:28
The euro/dollar rose yesterday, peaking at 1.0949. Signals are for upwards in the near future for testing of 1.1000 - 1.1050. Immediate support is seen at 1.0900, whose breakthrough can take the price to a trading neutral zone at 1.0850. The price is in a misleading phase now. The gap as a result of a fundamental events is sometimes filled, which means we can still see the pre-gap level of 1.0730 this week.


