


Advertisement
GBP/USD daily outlook

会员从Oct 02, 2014开始
905帖子
Mar 30, 2016 at 12:48
I think it's about to reverse.
Positivity

会员从Oct 11, 2013开始
769帖子
Mar 31, 2016 at 05:07
The GBPUSD stays in a range on the daily chart between the 1.4100 level and the 1.4500.

会员从Mar 28, 2016开始
94帖子
Apr 01, 2016 at 06:41
The GBPUSD attempted to push higher yesterday topped at 1.4459 but whipsawed to the downside and hit 1.4347 earlier today. As you can see on my H1 chart below, this fact could produce another false breakout (above 1.4400) bearish scenario. The bias is bearish in nearest term testing 1.4280 – 1.4200 region. My major technical outlook remains neutral and I think 1.4400 – 1.4500 region is a good place to sell with a tight stop loss above 1.4500.

会员从Mar 28, 2016开始
94帖子
Apr 01, 2016 at 09:01
The GBPUSD was indecisive yesterday. Price attempted to push higher, slipped above 1.4400 but again, failed to stay consistently above 1.4400. The bias remains bearish in nearest term testing 1.4280 – 1.4200 region. My major technical outlook remains neutral but as long as stay below 1.4500 I prefer a bearish scenario at this phase.
会员从Mar 28, 2016开始
94帖子
Apr 01, 2016 at 09:01
Summary :
Target Level : 1.431
Target Period : 20 hours
Analysis :
Triangle has broken through the support line at 31-Mar-19:00 2016 GMT-2. Possible bearish price movement forecast for the next 20 hours towards 1.431.
Supporting Indicators :
Downward sloping Moving Average
Resistance Levels :
( B ) 1.4426Last resistance turning point of Triangle.
Support Levels
( A ) 1.4328Last support turning point of Triangle.
Chart date range :
27-Mar-19:00 GMT-2-> 01-Apr-04:00 GMT-2
Data interval : hour
RSI: 34 Candles
MA: 34 Candles
会员从Oct 02, 2014开始
905帖子
Apr 04, 2016 at 11:20
Good upside move today.
Positivity
会员从Oct 11, 2013开始
769帖子
Apr 06, 2016 at 04:09
On the longer term the GBPUSD keeps its bearish momentum, therefore the pair may try to go and visit the latest low at the 1.3833 level.

会员从Nov 19, 2014开始
157帖子
Apr 06, 2016 at 09:49
Hey guys...its now just above Support. Got some Pips taking advantage of the decline from Resistance...
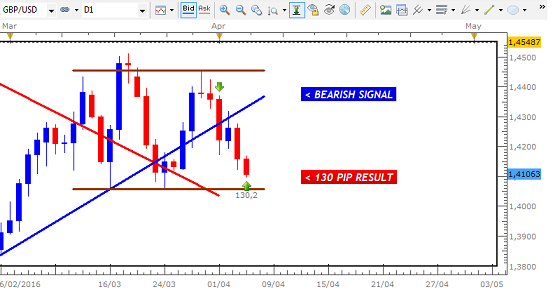
It`ll either rally at Support or breakout from the Range for continued USD gains...
Duane
DRFXSWINGTRADING
Trade Less, Earn More
会员从Mar 28, 2016开始
94帖子
Apr 08, 2016 at 07:12
The GBPUSD had a bearish momentum yesterday bottomed at 1.4048. The bias is bearish in nearest term testing 1.4000 key support. A clear break and daily/weekly close below that area could trigger further bearish pressure testing 1.3900 – 1.3800 area next week. Immediate resistance is seen around 1.4100. A clear break above that area could lead price to neutral zone in nearest term testing 1.4175 area.
会员从Mar 28, 2016开始
94帖子
Apr 09, 2016 at 10:28
Resistance break
会员从Mar 28, 2016开始
94帖子
Apr 09, 2016 at 10:29
Buy GBPUSD at 1.4050 TP 1.4100-1.4200 SL 1.4030

会员从Oct 11, 2013开始
769帖子
Apr 12, 2016 at 23:17
No clear trend on the GBPUSD on the longer term. For now it may be wise to stay out of it.


