


Advertisement
Gold during this week
Nov 23, 2015 at 02:34
777 Views
12 Replies

Member Since Oct 11, 2013
769 posts
Nov 23, 2015 at 02:34
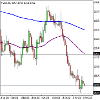
Gold may try to drop again during this week, but the 1063 level could act as a temporary support. To the upside, the 55 day exponential moving average, which is currently at the 1120 level could act as resistance in case gold retraces to the upside. But the Dollar stays strong and as long as the greenback holds on to its gains, it would be difficult for gold to rally.
Attachments:

Member Since Jul 10, 2014
1114 posts
Nov 28, 2015 at 13:35
The move to the downside continues and I wouldn't be surprised if it reaches 1000.

Member Since Oct 02, 2014
905 posts
Nov 29, 2015 at 12:09
I'm expecting below $1,000 before New Year.
Positivity
Member Since Oct 02, 2014
905 posts
Dec 20, 2015 at 20:21
Retraced just a bit, still in downtrend.
Positivity
Member Since Oct 11, 2013
769 posts
Dec 24, 2015 at 01:22
At least gold has stalled its drop and keeps consolidating. The 1098 could be its next resistance and the low at the 1046 level could still act as support.
Member Since Oct 02, 2014
905 posts
Dec 26, 2015 at 15:51
Interesting to see movements this week.
Positivity

Dec 27, 2015 at 13:18
I believe we will be seeing a big rally up in a month or two correcting the drop from 2008 or maybe even an impulse move.
As you can see on the weekly chart, we had a bearish triangle, which usually is followed by the final break down before we head up. and the drop was in a diagonal triangle this shows how weak drop is.
As you can see on the weekly chart, we had a bearish triangle, which usually is followed by the final break down before we head up. and the drop was in a diagonal triangle this shows how weak drop is.
wassim.azhari1@
Dec 27, 2015 at 13:18
I believe GOLD will rally up in the next month or two.
As you can see on the weekly gold chart, we had a bearish triangle which is usually followed by the last move down, and even the drop was in a diagonal triangle form.
This all show how weak the selling is for gold.
Sorry for posting twice but i forgot to attach image.
Thanks
.png)
As you can see on the weekly gold chart, we had a bearish triangle which is usually followed by the last move down, and even the drop was in a diagonal triangle form.
This all show how weak the selling is for gold.
Sorry for posting twice but i forgot to attach image.
Thanks
Attachments:
wassim.azhari1@

Member Since Oct 11, 2013
769 posts
Jan 12, 2016 at 03:13
Gold may retrace to the 1088 level, but if risk aversion comes in again into the markets, then the precious metal may try to reach again its recent high around the 1113 level.
Member Since Oct 02, 2014
905 posts
Jan 12, 2016 at 14:22
Expecting a move to the upside.
Positivity

*Commercial use and spam will not be tolerated, and may result in account termination.
Tip: Posting an image/youtube url will automatically embed it in your post!
Tip: Type the @ sign to auto complete a username participating in this discussion.


