(Here is a post I posted on another site that might be of interest to those here. This helps me stick to my Quant Method that might have poor performance in the short term)
I wanted to share real quick my favorite chart that helps me sleep at night. It has to do with losses. Losses over a day/week/month are to be expected. Everyone has losses but not all losing streaks are created equal. Too many traders adjust their techniques/system/method because of losing streaks. You need to know when your losing streak should be expected and part of the process and which losing streaks are telling you that your system sucks. Tracking your gains and losses is important so you can ask yourself two questions "Has this kind of streak happened to me before?" "Is this streak telling me something different than the previous losing streaks?"
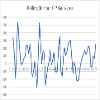
First screenshot is my 36 hour rolling PIP gain/loss. So basically this lets me know if my -200 or my -310 or my -280 or -240 is out of the ordinary or should I have expected it.
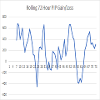
The second screenshot is the 72 hour rolling PIP gain/loss. If I dropped over 400 PIPs in the next 72 hours, would that be a game changer for me? No. It has happened to me in the past and it will happen to me in the future. Remember the old saying with regards to trading. "You have not had your worst day yet"
I pick 12 hour time frames because that is when I do my trades and adjustments. I do them at 5:00 AM EST and between 4:30PM-5:00PM EST