Advertisement
Technical & Fundamental Analysis by Sold ECN Securities

Jan 14, 2022 at 09:18
AUD/USD, the instrument is correcting at the end of the week
Current trend
The Australian dollar shows mixed trading dynamics against the US dollar during the Asian session, correcting after strong growth at the beginning of the week, which led to the renewal of local highs from November 16. The pressure on AUD/USD is exerted by technical factors, as well as by the oversold US currency in almost the entire spectrum of the market.
In turn, the instrument is supported by optimistic data from Australia and China. Home Loans in Australia increased by 7.6% in November after falling by 4.1% in October. Analysts expected zero dynamics. The Investment Lending for Homes over the same period also increased from 1.1% to 3.8%. Data from China showed stronger export growth in December: 20.9% against the expected 20.0%. Together with a slowdown in import dynamics from 31.7% to 19.5%, this led to a significant increase in the trade balance in December from 71.72B to 94.46B dollars.
Support and resistance
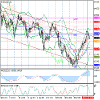
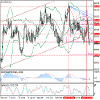
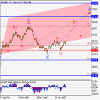
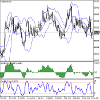
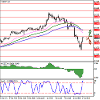
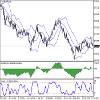
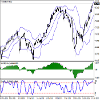
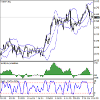
Bollinger Bands in D1 chart show moderate growth. The price range expands from above, freeing a path to new local highs for the "bulls". MACD indicator is growing, while preserving a rather stable buy signal (located above the signal line). Stochastic keeps its upward direction but is approaching its highs rapidly, which reflects risks of the overbought instrument in the ultra-short term.
Resistance levels: 0.7300, 0.7328, 0.7369, 0.7408.
Support levels: 0.7250, 0.7200, 0.7160, 0.7128.
Current trend
The Australian dollar shows mixed trading dynamics against the US dollar during the Asian session, correcting after strong growth at the beginning of the week, which led to the renewal of local highs from November 16. The pressure on AUD/USD is exerted by technical factors, as well as by the oversold US currency in almost the entire spectrum of the market.
In turn, the instrument is supported by optimistic data from Australia and China. Home Loans in Australia increased by 7.6% in November after falling by 4.1% in October. Analysts expected zero dynamics. The Investment Lending for Homes over the same period also increased from 1.1% to 3.8%. Data from China showed stronger export growth in December: 20.9% against the expected 20.0%. Together with a slowdown in import dynamics from 31.7% to 19.5%, this led to a significant increase in the trade balance in December from 71.72B to 94.46B dollars.
Support and resistance
Bollinger Bands in D1 chart show moderate growth. The price range expands from above, freeing a path to new local highs for the "bulls". MACD indicator is growing, while preserving a rather stable buy signal (located above the signal line). Stochastic keeps its upward direction but is approaching its highs rapidly, which reflects risks of the overbought instrument in the ultra-short term.
Resistance levels: 0.7300, 0.7328, 0.7369, 0.7408.
Support levels: 0.7250, 0.7200, 0.7160, 0.7128.
첨부 파일:
Solid ECN, a True ECN Broker
Jan 14, 2022 at 10:13
CAC 40 Technical Analysis by Solid ECN Securities
The French market is preparing for the start of reporting
Current trend
The CAC 40 index is correcting down ahead of the start of the annual reports of companies, being at around 7133.0.
The main wave of publication of financial results will start next week. Tech stocks have been leading throughout the week due to a correction in the bond market. Among the growth leaders are the shares of software maker Sopra Steria Group SA, whose annual profit forecast was significantly raised, exceeding 5B euros. Now the company's shares are growing by 5.67% and, apparently, the positive dynamics may continue.
The main support for technology companies comes from the bond market, which continues a serious downward correction. At the beginning of this week, 10-year bonds traded at a yield of 0.298%, and now the figure has fallen to 0.229%. However, the most significant downtrend is shown by 8-year bonds of France, the yield on which only yesterday fell by 42.86%, and now has returned to the negative zone again at the level of -0.030%.
The growth leaders in the index are Renault SA (+4.58%), Stellantis NV (+3.45%), STMicroelectronics NV (+3.09%), BNP Paribas SA (+2.50%).
Among the leaders of the decline are Kering SA (-3.61%), Hermes International (-3.17%), L’Oreal SA (-2.81%), Teleperformance SE (-2.67%).
Support and resistance
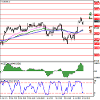
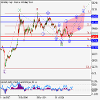
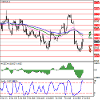
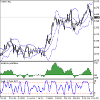
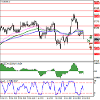
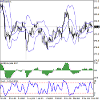
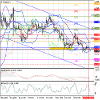
The quotes of the asset are traded within the global ascending channel, having reversed downwards. Technical indicators maintain a weakening buy signal: the range of the Alligator indicator EMAs fluctuations began to narrow down and the histogram of the AO oscillator forms descending bars, being above the transition level.
Support levels: 7074.0, 6720.0.
Resistance levels: 7238.0, 7450.0.
The French market is preparing for the start of reporting
Current trend
The CAC 40 index is correcting down ahead of the start of the annual reports of companies, being at around 7133.0.
The main wave of publication of financial results will start next week. Tech stocks have been leading throughout the week due to a correction in the bond market. Among the growth leaders are the shares of software maker Sopra Steria Group SA, whose annual profit forecast was significantly raised, exceeding 5B euros. Now the company's shares are growing by 5.67% and, apparently, the positive dynamics may continue.
The main support for technology companies comes from the bond market, which continues a serious downward correction. At the beginning of this week, 10-year bonds traded at a yield of 0.298%, and now the figure has fallen to 0.229%. However, the most significant downtrend is shown by 8-year bonds of France, the yield on which only yesterday fell by 42.86%, and now has returned to the negative zone again at the level of -0.030%.
The growth leaders in the index are Renault SA (+4.58%), Stellantis NV (+3.45%), STMicroelectronics NV (+3.09%), BNP Paribas SA (+2.50%).
Among the leaders of the decline are Kering SA (-3.61%), Hermes International (-3.17%), L’Oreal SA (-2.81%), Teleperformance SE (-2.67%).
Support and resistance
The quotes of the asset are traded within the global ascending channel, having reversed downwards. Technical indicators maintain a weakening buy signal: the range of the Alligator indicator EMAs fluctuations began to narrow down and the histogram of the AO oscillator forms descending bars, being above the transition level.
Support levels: 7074.0, 6720.0.
Resistance levels: 7238.0, 7450.0.
첨부 파일:
Solid ECN, a True ECN Broker
Jan 14, 2022 at 11:47
Cryptocurrency Market Review
This week, the cryptocurrency market attempted to grow. As a result, the leading assets strengthened their positions. Currently, BTC is trading around 42800.00 (+1.2%), ETH is at 3300.00 (+3.5%). The BNB token returned to third place and is moving around 485.00 (+10.2%). USDT is at 1.0004 (+0.02%) and SOL is around 148.00 (+4.5%). The total market capitalization reached 2.051T dollars by the end of the week. The share of BTC has decreased to 39.55%.
The upward movement of the market is likely to be speculative since there are no obvious fundamental growth factors. Support for digital currencies and other alternative assets was provided by the general weakening of the US dollar associated with high inflation in the United States and investors' doubts about the ability of the US Federal Reserve to limit it this year.
Traders are focused on the comments of US officials. In an interview with CNBC, the head of the US Securities and Exchange Commission (SEC), Gary Gensler, evaded the question of whether ETH is security, saying that the commission did not give public legal advice. However, Gensler noted that companies that collected money from citizens and promised them profits could fall under securities laws. He also confirmed the need to create legal mechanisms that allow investors to receive all the necessary information from cryptocurrency companies before investing. The SEC continues the lawsuit with Ripple, proving that the XRP token was a security, and the company's management violated relevant US law when creating it. Ripple lawyers are trying to get an explanation from the regulator about why it considers XRP security, while several other currencies, in particular ETH, do not, hinting at the agency's bias. In this context, Gensler's refusal to comment on the status of ETH may indicate the weakness of the regulator's position and the prospects for Ripple to win the lawsuit. On Tuesday, at a Senate hearing, US Federal Reserve Chairman Jerome Powell promised to submit a report on studying the prospects for a national digital currency (CBDC) soon, which will be an important step towards creating a digital dollar. Powell also said that CBDC would not force private stablecoins out of the market, and they would be able to coexist.
From the news of the financial industry, it is worth noting the possibility of launching the payment company PayPal Holdings Inc.'s stablecoin backed by the US dollar, according to Bloomberg sources. Employees of the corporation note that the new currency should ensure the expansion of payments and customers' security. The product is currently under development and is awaiting approval from US regulators. Meanwhile, payment giant Visa Inc. in collaboration with ConsenSys, develops a technical solution for using state digital currencies in everyday payments. The corporation's management said that the company has already held consultations with the central tanks of several countries. The implementation of the new solution will allow customers to make any payments using CBDC at all points that accept Visa cards. Corporation employees surveyed small businesses in nine countries and found that 24% of them are ready to accept payments in the digital currency this year. Not surprisingly, the public's continued adoption of crypto assets is pushing Visa Inc. and other major financial companies to expand their cryptocurrency services. Finally, this week, it became known that Tesla Inc. is preparing to sell some of its products for DOGE and SHIB tokens. Currently, payment technologies are being tested, but the purchase itself is not yet available. Given the constant support of the head of the corporation Elon Musk of digital assets, especially DOGE, it can be assumed that payments in cryptocurrencies will be accepted soon.
Next week, quotes of most cryptocurrencies may consolidate or resume their decline.
Solid ECN, a True ECN Broker
Jan 14, 2022 at 12:43
USD/CHF, Fibonacci analysis by Solid ECN Securities
USD/CHF, D1
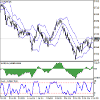
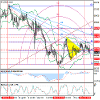
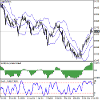
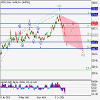
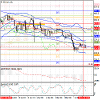
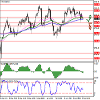
On the daily chart, the price reached 0.9260 (retracement of 61.8%), but then sharply corrected down and is now trying to gain a foothold below the level of 0.9110 (retracement of 0.0%). If successful, the decline will continue to the area of 0.9020 (expansion of 100.0%). In case of a breakout of 0.9166 (retracement of 23.6%, the middle line of the Bollinger Bands), the price will be able to return to 0.9230 (retracement of 50.0%) or 0.9260 (retracement of 61.8%). Technical indicators point out a continuation of the decline: the Bollinger Bands and Stochastic are directed downwards, and the MACD histogram increases in the negative zone.
USD/CHF, W1
On the weekly chart, the price continues to decline along the 38.2% descending fan line. Currently, the quotes are trying to gain a foothold below the 0.9150 mark (retracement of 23.6%), but so far without success. If successful, the decline will continue to the levels of 0.8950 (near the June lows) and 0.8825 (retracement of 0.0%). In case of a breakout of 0.9190 (the middle line of the Bollinger Bands), the growth will be able to continue to 0.9350 (retracement of 38.2%). Technical indicators do not give a single signal: the Bollinger Bands are horizontal, the Stochastic is directed down, but approaches the oversold zone, which does not exclude a reversal, and the MACD histogram decreases in the positive zone.
Support and resistance
Generally, the continuation of the price decline seems more likely. Its targets may be 0.9020 (expansion of 100.0%, D1) and 0.8950 (the area of June lows). In case of a breakout of 0.9190 (the middle line of the Bollinger Bands, W1), it will be possible to start growth towards 0.9260 (retracement of 61.8%, D1) and 0.9350 (retracement of 38.2%, W1).
Resistance levels: 0.9190, 0.9260, 0.9350.
Support levels: 0.9020, 0.8950, 0.8825.
USD/CHF, D1
On the daily chart, the price reached 0.9260 (retracement of 61.8%), but then sharply corrected down and is now trying to gain a foothold below the level of 0.9110 (retracement of 0.0%). If successful, the decline will continue to the area of 0.9020 (expansion of 100.0%). In case of a breakout of 0.9166 (retracement of 23.6%, the middle line of the Bollinger Bands), the price will be able to return to 0.9230 (retracement of 50.0%) or 0.9260 (retracement of 61.8%). Technical indicators point out a continuation of the decline: the Bollinger Bands and Stochastic are directed downwards, and the MACD histogram increases in the negative zone.
USD/CHF, W1
On the weekly chart, the price continues to decline along the 38.2% descending fan line. Currently, the quotes are trying to gain a foothold below the 0.9150 mark (retracement of 23.6%), but so far without success. If successful, the decline will continue to the levels of 0.8950 (near the June lows) and 0.8825 (retracement of 0.0%). In case of a breakout of 0.9190 (the middle line of the Bollinger Bands), the growth will be able to continue to 0.9350 (retracement of 38.2%). Technical indicators do not give a single signal: the Bollinger Bands are horizontal, the Stochastic is directed down, but approaches the oversold zone, which does not exclude a reversal, and the MACD histogram decreases in the positive zone.
Support and resistance
Generally, the continuation of the price decline seems more likely. Its targets may be 0.9020 (expansion of 100.0%, D1) and 0.8950 (the area of June lows). In case of a breakout of 0.9190 (the middle line of the Bollinger Bands, W1), it will be possible to start growth towards 0.9260 (retracement of 61.8%, D1) and 0.9350 (retracement of 38.2%, W1).
Resistance levels: 0.9190, 0.9260, 0.9350.
Support levels: 0.9020, 0.8950, 0.8825.
첨부 파일:
Solid ECN, a True ECN Broker
Jan 14, 2022 at 15:47
Don't eat McDonald but Trade it!
General Review by Solid ECN
Current trend
The stocks of McDonald's Corp., the world's largest food retailer, are correcting at $261 a share.
Some details of the company's upcoming deal with Mastercard Inc. on the sale of the startup Dynamic Yield. Mastercard Inc. became interested in the application in the fall, but the contract details were made public only now. It is expected that despite the sale of the application, the companies will continue to cooperate in its use, and the preliminary price will be about $300M. The full closing of the transaction is expected in Q2 2022.
On January 27, the Q4 report on the corporation's work will be released. According to analysts' forecasts, the profit could reach about $6.04B, in line with previous periods. Another serious increase is expected from the EPS indicator, which can reach 10–11% or $2.45–2.47 per share. The last dividend payment took place on December 15, when investors received $1.38 per share, corresponding to a yield of 2.21% per annum.
Support and resistance
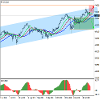
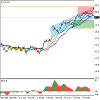
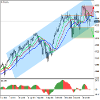
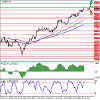
The global uptrend continues within the uptrend. However, the readings of technical indicators reflect that the price may leave its limits soon: the histogram of the AO oscillator actively approaches the transition level, and the fast EMAs of the Alligator indicator almost reached the signal line and are ready to cross it.
Resistance levels: 266.00, 277.00.
Support levels: 256.00, 244.00.
General Review by Solid ECN
Current trend
The stocks of McDonald's Corp., the world's largest food retailer, are correcting at $261 a share.
Some details of the company's upcoming deal with Mastercard Inc. on the sale of the startup Dynamic Yield. Mastercard Inc. became interested in the application in the fall, but the contract details were made public only now. It is expected that despite the sale of the application, the companies will continue to cooperate in its use, and the preliminary price will be about $300M. The full closing of the transaction is expected in Q2 2022.
On January 27, the Q4 report on the corporation's work will be released. According to analysts' forecasts, the profit could reach about $6.04B, in line with previous periods. Another serious increase is expected from the EPS indicator, which can reach 10–11% or $2.45–2.47 per share. The last dividend payment took place on December 15, when investors received $1.38 per share, corresponding to a yield of 2.21% per annum.
Support and resistance
The global uptrend continues within the uptrend. However, the readings of technical indicators reflect that the price may leave its limits soon: the histogram of the AO oscillator actively approaches the transition level, and the fast EMAs of the Alligator indicator almost reached the signal line and are ready to cross it.
Resistance levels: 266.00, 277.00.
Support levels: 256.00, 244.00.
첨부 파일:
Solid ECN, a True ECN Broker
Jan 14, 2022 at 16:28
Mastercard Inc, general review
Current trend
The stocks of Mastercard Inc. trades near the 5-month high, strengthening since the beginning of the week. Since the December 52-week low, the issuer rose more than 1.43%, while the S&P 500 index added 0.56% over the same period.
The company announced the appointment to the Board of Directors of Harit Talwar as an independent director from April 2022. According to the past quarter results, The Wall Street experts forecast the corporation's revenue growth by 24.4% YoY to $5.12B with an increase in earnings per share by 33.5% YoY to $2.19. Mastercard Inc. announced new partnerships with BMO and Moneris Solutions Corp., which have joined the Mastercard Track business payment service, one of the first open-loop commercial solutions.
Previously approved, an 11% YoY increase in quarterly dividends to $0.49 per share. The payment will take place on February 9, 2022. Also, management announced a new $8B share buyback program.
Support and resistance
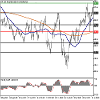
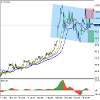
The last trading sessions are quite active, but no unidirectional trend is observed. At the moment, the key support and resistance levels are 349.00 and 382.00, respectively. There is potential for recovery. Indicators indicate the strength of buyers: the price consolidated above MA (50) and MA (200), MACD histogram started to rise. It is better to open the positions from the key levels.
Comparative analysis of the company's multipliers and companies-competitors in the industry indicates the neutrality of the asset.
Resistance levels: 371.00, 382.00, 394.00.
Support levels: 357.00, 349.00, 336.00.
Current trend
The stocks of Mastercard Inc. trades near the 5-month high, strengthening since the beginning of the week. Since the December 52-week low, the issuer rose more than 1.43%, while the S&P 500 index added 0.56% over the same period.
The company announced the appointment to the Board of Directors of Harit Talwar as an independent director from April 2022. According to the past quarter results, The Wall Street experts forecast the corporation's revenue growth by 24.4% YoY to $5.12B with an increase in earnings per share by 33.5% YoY to $2.19. Mastercard Inc. announced new partnerships with BMO and Moneris Solutions Corp., which have joined the Mastercard Track business payment service, one of the first open-loop commercial solutions.
Previously approved, an 11% YoY increase in quarterly dividends to $0.49 per share. The payment will take place on February 9, 2022. Also, management announced a new $8B share buyback program.
Support and resistance
The last trading sessions are quite active, but no unidirectional trend is observed. At the moment, the key support and resistance levels are 349.00 and 382.00, respectively. There is potential for recovery. Indicators indicate the strength of buyers: the price consolidated above MA (50) and MA (200), MACD histogram started to rise. It is better to open the positions from the key levels.
Comparative analysis of the company's multipliers and companies-competitors in the industry indicates the neutrality of the asset.
Resistance levels: 371.00, 382.00, 394.00.
Support levels: 357.00, 349.00, 336.00.
첨부 파일:
Solid ECN, a True ECN Broker
Jan 17, 2022 at 06:50
XAG/USD: wave analysis
The pair may grow.
On the daily chart, the first wave of the higher level (1) of 3 formed, a downward correction developed as the wave (2) of 3, and the development of the third wave (3) of 3 started. Now, the first wave of the lower level i of 1 of (3) has formed, a local correction has developed as the wave ii of 1, and the formation of the wave iii of 1 has started, within which the development of the wave (iii) of iii has started. If the assumption is correct, the price will grow to the levels of 26.76–28.68. In this scenario, critical stop loss level is 21.91.
첨부 파일:
Solid ECN, a True ECN Broker
Jan 17, 2022 at 07:41
GBP/USD, the pound retreated from its local highs for a short time
Current trend
The British pound traded with rising dynamics against the US currency during the morning session, recovering from the "bearish" correction last Friday. The end of the last trading week was marked by an active rise in the US dollar exchange rate, and there were practically no fundamental reasons for this.
In turn, the macroeconomic statistics from the UK, which appeared last Friday, provided additional support to the pound. UK GDP rose 0.9% in November after rising 0.2% in October. Analysts expected an increase of only 0.4%. The growth rate of Industrial Production for the same period amounted to 1.0%, while the market expected only 0.2%. In October, production volumes showed negative dynamics at the level of –0.5%. In annual terms, however, production slowed down from 0.2% to 0.1%, which was much worse than investors' expectations of growth of 0.5%.
Support and resistance
Bollinger Bands in D1 chart show stable growth. The price range is slightly narrowing, staying spacious enough for the current activity level in the market. MACD indicator is declining and is getting ready to form a new sell signal (the histogram should consolidate below the signal line). Stochastic shows a slightly more confident decline, quickly retreating from its highs.
Resistance levels: 1.3700, 1.3750, 1.3800, 1.3833.
Support levels: 1.3650, 1.3600, 1.3550, 1.3500.
첨부 파일:
Solid ECN, a True ECN Broker
Jan 17, 2022 at 08:56
USD/CHF, the US currency is recovering
Current trend
The US dollar shows strong growth against the Swiss franc during the Asian session, building on the "bullish" momentum that was formed at the end of last week, when the pair consolidated near the local lows of November 2, 2021. At the moment, the development of the uptrend is mainly supported by technical factors, while the block of data from the US released on January 14 turned out to be frankly weak.
In particular, investors were disappointed by the sharp drop in Retail Sales in December by 1.9% after rising by 0.2% in November. The Retail Sales Control Group fell to a record 3.1% over the same period after falling 0.5% in November. Michigan Consumer Sentiment Index in January fell from 70.6 to 68.8 points, while analysts had expected a decline to only 70 points.
Markets in the US are closed today to celebrate Martin Luther King, Jr. Day, so trading activity is likely to be somewhat reduced.
Support and resistance
Bollinger Bands in D1 chart demonstrate flat dynamics. The price range is changing slightly, but remains rather spacious for the current level of activity in the market. MACD is going down preserving a previous sell signal (located below the signal line). Stochastic, which has reached its lows, is trying to reverse upward, signaling in favor of the development of corrective growth in the nearest time intervals.
Resistance levels: 0.9157, 0.9175, 0.9200, 0.9220.
Support levels: 0.9125, 0.9100, 0.9073, 0.9036.
첨부 파일:
Solid ECN, a True ECN Broker
Jan 17, 2022 at 10:30
Netflix Inc, Elliot Wave Analysis
The price may fall.
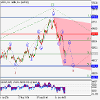
On the daily chart, the third wave of the higher level (3) developed, and a downward correction started to develop as the fourth wave (4). Now, the wave and of (4) is forming, within which the third wave of the lower level iii of A has formed, and a local correction is developing as the wave iv of A. If the assumption is correct, after the end of the correction, the price will fall to the levels of 465.32–411.70. In this scenario, critical stop loss level is 620.94.
The price may fall.
On the daily chart, the third wave of the higher level (3) developed, and a downward correction started to develop as the fourth wave (4). Now, the wave and of (4) is forming, within which the third wave of the lower level iii of A has formed, and a local correction is developing as the wave iv of A. If the assumption is correct, after the end of the correction, the price will fall to the levels of 465.32–411.70. In this scenario, critical stop loss level is 620.94.
첨부 파일:
Solid ECN, a True ECN Broker
Jan 17, 2022 at 14:03
USD/JPY: US dollar wins back its losses
Current trend
The US dollar shows strong growth against the Japanese yen in Asian trading, quickly retreating from local lows, updated at the end of the last trading week. On Friday, the US currency updated its lows from December 20, 2021, dropping just below 113.50. Nevertheless, the instrument failed to consolidate at new levels, and already on the same day the US dollar won back most of its losses.
It is also worth noting that on Friday a large block of macroeconomic statistics was released in the US, which turned out to be quite weak, but did not cause the expected negative reaction on the market. Anyway, along with a significant drop in Retail Sales, the data also reflected a decline in Industrial Production in December by 0.1%, while analysts had expected it to grow moderately by 0.4%. Michigan Consumer Sentiment Index in January fell from 70.6 to 68.8 points, which turned out to be worse than forecasts for a decline to 70 points.
Support and resistance
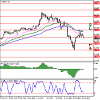
In the D1 chart, Bollinger Bands are reversing horizontally. The price range is expanding from below, remaining spacious enough for the current activity level in the market. MACD is going down preserving a stable sell signal (located below the signal line). The indicator is about to test the zero level for a breakdown. Stochastic, on the contrary, indicates the growth of the instrument. The indicator reversed upwards near its lows, reflecting the strongly oversold dollar in the ultra-short term.
Resistance levels: 114.50, 115.00, 115.50, 116.00.
Support levels: 114.00, 113.50, 113.00, 112.50.
Current trend
The US dollar shows strong growth against the Japanese yen in Asian trading, quickly retreating from local lows, updated at the end of the last trading week. On Friday, the US currency updated its lows from December 20, 2021, dropping just below 113.50. Nevertheless, the instrument failed to consolidate at new levels, and already on the same day the US dollar won back most of its losses.
It is also worth noting that on Friday a large block of macroeconomic statistics was released in the US, which turned out to be quite weak, but did not cause the expected negative reaction on the market. Anyway, along with a significant drop in Retail Sales, the data also reflected a decline in Industrial Production in December by 0.1%, while analysts had expected it to grow moderately by 0.4%. Michigan Consumer Sentiment Index in January fell from 70.6 to 68.8 points, which turned out to be worse than forecasts for a decline to 70 points.
Support and resistance
In the D1 chart, Bollinger Bands are reversing horizontally. The price range is expanding from below, remaining spacious enough for the current activity level in the market. MACD is going down preserving a stable sell signal (located below the signal line). The indicator is about to test the zero level for a breakdown. Stochastic, on the contrary, indicates the growth of the instrument. The indicator reversed upwards near its lows, reflecting the strongly oversold dollar in the ultra-short term.
Resistance levels: 114.50, 115.00, 115.50, 116.00.
Support levels: 114.00, 113.50, 113.00, 112.50.
첨부 파일:
Solid ECN, a True ECN Broker
Jan 17, 2022 at 14:59
S&P 500: the beginning of the reporting season has disappointed investors
Current trend
Due to a not very positive start to corporate reporting, the leading index of the US economy, S&P 500, corrects downwards, trading around 4655.0.
Among the index's major components, financial conglomerate JPMorgan Chase & Co. was one of the first to publish its data, showing a quarterly income of $29.26B, which was below $29.65B a quarter earlier and $29.78B predicted by analysts. Despite the poor earnings performance, earnings per share were $3.33, well above the $3.01 expected. Bad news came from the large pharmacy chain Walgreens Boots Alliance. The company said some pharmacies would close over the weekend as the state is understaffed by the continued spread of the omicron strain. These reports come after fourth-quarter earnings of $33.9B were reported, well ahead of the $32.88B forecasted.
Securities again began to rise, putting additional pressure on the stock market. Leading 10-year US bonds are trading at 1.793%, up from Friday's 1.750%.
Growth leaders include Las Vegas Sands Corp. (+14.15%), Wynn Resorts Ltd. (+8.60%), and Discovery Inc. (+7.04%).
Among the decline leaders there are JPMorgan Chase & Co. (–6.15%), Monster Beverage Corp. (–4.73%), and Simon Property Group Inc. (–4.47%).
Support and resistance
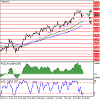
The index quotes move within a global upward channel near the support line. Technical indicators reversed and gave a local sell signal: indicator Alligator's EMA fluctuations range expands downwards, and the histogram of the AO oscillator trades in the sell zone.
Resistance levels: 4710.0, 4800.0.
Support levels: 4593.0, 4500.0.
첨부 파일:
Solid ECN, a True ECN Broker
Jan 17, 2022 at 16:10
Tesla Inc, General Review
Current trend
The stocks of Tesla Inc., the world's leading manufacturer of electric cars, continue the global correction, trading at 1049.00.
Due to a large amount of incoming information, the instrument's volatility remains high. Yesterday, the corporation announced that the production of the long-awaited new Cybertruck was postponed again, and its start is postponed to Q1 2023. It was previously planned to start work in the second half of 2022, but the delay is caused by the desire of the developers to make changes to the features and functionality of the truck.
Global sales of leading US assets by large investors continue. Following the head of Tesla Inc., Elon Musk, they began to sell shares and large funds. On Thursday, the ARK Innovation ETF and ARK Generation Internet ETF sold a total of 87.756K shares of the company for over $90M.
The financial report will be published on 26 January. Analysts expect quarterly revenue to reach a record $16.79B despite the sell-off and negative news, and earnings per share could hit $2.21.
Support and resistance
Quotes are moving within the corrective downward channel, after which the global uptrend may continue. Technical indicators keep a poor buy signal: fast EMAs on the Alligator indicator are above the signal line, and the AO oscillator histogram moves close to the transition level.
Resistance levels: 1105, 1200.
Support levels: 1000, 892.
첨부 파일:
Solid ECN, a True ECN Broker
Jan 18, 2022 at 07:45
AUD/USD: Australian currency develops a "bearish" momentum
Current trend
The Australian dollar shows an active decline against the US currency during the Asian session, developing the corrective momentum of last Friday and testing the level of 0.7200 for a breakdown.
The US dollar is again in demand on the market amid expectations of an increase in interest rates by the US Fed. In addition, traders are somewhat concerned about the rapid increase in the dynamics of the incidence of coronavirus, which threatens the recovery of the global economy.
Support and resistance
Bollinger Bands in D1 chart demonstrate a stable decrease. The price range is almost constant, remaining rather spacious for the current level of activity in the market. MACD is declining keeping a weak sell signal (located below the signal line). Stochastic keeps a confident downward direction but is rapidly approaching its lows, which indicates the risks of oversold instrument in the ultra-short term.
Resistance levels: 0.72, 0.725, 0.73, 0.7328.
Support levels: 0.716, 0.7128, 0.71, 0.705.
첨부 파일:
Solid ECN, a True ECN Broker
Jan 18, 2022 at 10:39
ETH/USD
Singapore government rhetoric reinforces the "bearish" trend
Current trend
The ETH/USD pair started the current week with a decline within the general market trend.
Medium-term pressure on the sector is exerted by investors' expectation of a tightening of the monetary policy of the US Federal Reserve. The completion of the emergency program of bond purchases and the first increase in interest rates may occur as early as March, leading to further strengthening of the US currency. An additional negative factor for ETH could be the tightening of regulation of the cryptocurrency industry in Singapore. The other day, the country's monetary authority (MAS) banned the widespread advertising of digital assets and the installation of cryptomats. Officials explained their decision to complicate access to tokens to prevent rash trade in them and protect their citizens. All firms working with digital assets, including banks, payment services, and exchanges, fall under the new rules.
Singapore is one of the leading countries in terms of the population's degree of acceptance of ETH. According to experts, more than 43% of local traders own this particular cryptocurrency, and tightening regulation of the sector may make it difficult to work with the asset.
Support and resistance
Resistance levels: 3437.50, 3750.00, 4140.00.
Support levels: 3125.00, 2812.50, 2500.00, 2300.00.
첨부 파일:
Solid ECN, a True ECN Broker
Jan 18, 2022 at 14:08
Crude Oil, Market Analysis in 1 Minute
Current trend
During the Asian session, Brent Crude Oil prices are actively growing, testing the level of 87.00 for a breakout and renewing record highs since October 2018.
The quotes are moderately supported by the weakening of investors' fears that the rapid spread of the Omicron strain will negatively affect the pace of national economic recovery from the consequences of the coronavirus pandemic. In the meantime, indicators continue to stabilize, and the leading central banks are ready to continue the tightening monetary policy cycle. However, some skeptics still fear that the recovery in demand may not be able to keep with the increase in supply, given all the current risks.
On Monday, the quotes of "black gold" traded with restraint against the backdrop of news from Libya, where production volumes recovered to 1.2M barrels per day. Last week, it declined noticeably due to the blocking of several western fields.
Support and resistance
On the daily chart, Bollinger Bands steadily grow. The price range widens, but not as fast as the "bullish" sentiment develops in the short term. The MACD indicator grows, keeping a strong buy signal (the histogram is above the signal line). Stochastic keeps a confident upward trend but is close to its highs, indicating that the instrument may become overbought in the ultra-short term.
It is better to keep the current long positions until the signals from technical indicators are clarified.
Resistance levels: 87.00, 88.50, 89.50.
Support levels: 86.00, 84.50, 83.50, 82.64.
첨부 파일:
Solid ECN, a True ECN Broker
Jan 19, 2022 at 08:07
Gold is consolidating at $1800
Current trend
Gold prices are consolidating near the psychological support at $1800, developing a weak downtrend since the end of last trading week. Demand for the precious metal is moderately declining as investor activity recovers. Traders ignore the difficult epidemiological situation in the world and focus on the prospects for further tightening of monetary policy by leading financial regulators. First of all, one should expect a rate increase from the US Federal Reserve and the Bank of England, while the European Central Bank is in no hurry to take active steps, waiting for more clear signals from the economy.
The macroeconomic statistics from the US released the day before did not have a noticeable impact on the dynamics of the instrument; however, it attracted attention with a sharp drop in the new york Empire State Manufacturing Index. In January, the indicator fell from 31.9 to -0.7 points, while forecasts suggested a decline to only 25.7 points.
Today, investors are focused on the statistics from the US on the dynamics of the construction market and data from Canada on the Consumer Price Index for December. In turn, statistics on inflation in Germany and the UK will be released in Europe.
Support and resistance
In the daily chart, Bollinger Bands are reversing horizontally. The price range is slightly narrowing from above, reflecting the correctional decline in the short term. MACD is declining keeping a weak sell signal. Stochastic shows a more confident decline, but at the moment it is quickly approaching its lows, indicating growing risks of the instrument being oversold in the ultra-short term.
Resistance levels: $1814, $1823, $1831.
Support levels: $1805, $1800, $1790, $1778.32
첨부 파일:
Solid ECN, a True ECN Broker
Jan 19, 2022 at 10:33
USD/JPY
The US dollar corrects after a failed upside attempt
Current trend
The US dollar is developing mixed dynamics in Asian trading, consolidating near 114.50. The day before, the American currency made another attempt to grow and even renewed local highs from January 12, but it failed to consolidate on new positions, and USD/JPY ended the trading session near zero.
The pressure on the quotes of the instrument was exerted by not the most confident macroeconomic data from the US, while the yen took a lead from the decision of the Bank of Japan and moderately weak statistics on Industrial Production. The day before, the Japanese regulator made the expected decision to keep the monetary policy parameters unchanged. At the same time, the Bank of Japan adjusted its forecast for inflation, which, however, still does not create any tangible risks for the national economy. As for macroeconomic statistics, the released data reflected a slowdown in Industrial Production in November from 7.2% to 7.0%, and in annual terms it decreased from 5.4% to 5.1%.
Support and resistance
On the D1 chart, Bollinger Bands are gradually reversing horizontally. The price range is expanding from below, remaining spacious enough for the current activity level in the market. MACD is going down preserving a weak sell signal, located below the signal line. Stochastic, on the contrary, is showing active growth and has not yet reacted to the appearance of "bearish" dynamics.
Resistance levels: 115, 115.5, 116, 116.5.
Support levels: 114.5, 114, 113.5, 113.
첨부 파일:
Solid ECN, a True ECN Broker
Jan 19, 2022 at 14:36
XRP/USD Technical Analysis
Current trend
The XRP/USD pair continues to trade within the long-term descending channel.
Last week, the token price attempted to rise to the level of 0.7812 (Murray [0/8]), supported by the middle line of Bollinger Bands, but could not break above it and resumed the decline. Currently, the quotes are trying to gain a foothold below 0.7500 (Fibo retracement of 61.8%) in order to continue the downward trend to the area of 0.5860 (Murray [-2/8]) and 0.5110 (the area of the lows of July last year).
The 0.7812 level remains key for the "bulls". Its breakout will give the prospect of growth of the trading instrument to 0.9100 (Fibo retracement of 50.0%), however, this option of price movement seems less likely, since the indicators point out the continuation of the downward trend: the Bollinger Bands and Stochastic are directed downwards, the MACD histogram is stable in the negative zone.
Support and resistance
Resistance levels: 0.7812, 0.9100, 0.9766.
Support levels: 0.7500, 0.6836, 0.5860, 0.5110.
첨부 파일:
Solid ECN, a True ECN Broker