


Advertisement
USDCHF 28.05.2014
May 28, 2014 at 17:21
627流覽
13 Replies

May 28, 2014 at 17:21
Anyone watching overbought USDCHF today?
Will it form a shooting star or engulfing pattern today/tomorrow with the 200P SMA sitting right on its top (D1 chart) and then collapse? Or will it attempt to touch psych level 0.90000 before it will eventually reverse?
k4y
Will it form a shooting star or engulfing pattern today/tomorrow with the 200P SMA sitting right on its top (D1 chart) and then collapse? Or will it attempt to touch psych level 0.90000 before it will eventually reverse?
k4y

會員從Nov 21, 2011開始
1601帖子
May 28, 2014 at 19:29
Last Long signal was issued 20 days ago.
For the moment, there is no reason to sell this pair. (no sell signal on market)
Let's see how market will react from this psycho level.
http://www.myfxbook.com/forex-charts/USDCHF,D1/22601
For the moment, there is no reason to sell this pair. (no sell signal on market)
Let's see how market will react from this psycho level.
http://www.myfxbook.com/forex-charts/USDCHF,D1/22601

會員從Oct 11, 2013開始
769帖子
May 29, 2014 at 03:44
Seems like there will be continuation of the uptrend. On the weeklly chart the pair has a wide space to run.
會員從Nov 21, 2011開始
1601帖子
May 30, 2014 at 07:28
No sell signal while market is above 0.8950
May 30, 2014 at 10:32
Sometimes it's worth to try/risk an early entry.
If there is no bearish signal in day chart yet, you could find one in a lower timeframe (i.e. 15min or 30min chart), open a short position based on that signal, let it run into profit, continuously keeping an eye on the higher timeframes. As soon as a signal occures in a higher TF, switch over to that TF, increase the distance of TP level accordingly, and so on...
If there is no bearish signal in day chart yet, you could find one in a lower timeframe (i.e. 15min or 30min chart), open a short position based on that signal, let it run into profit, continuously keeping an eye on the higher timeframes. As soon as a signal occures in a higher TF, switch over to that TF, increase the distance of TP level accordingly, and so on...
會員從Nov 21, 2011開始
1601帖子
May 30, 2014 at 11:03
Each one his own strategy. Mine isn't based on such low TimeFrame. I trade the trend. As long as the trend is unchanged , if I have to enter it would be into the major trend direction.
It's funny and paradoxal. I trade the trend and I'm a contrarian in the same time as 75% traders are short.
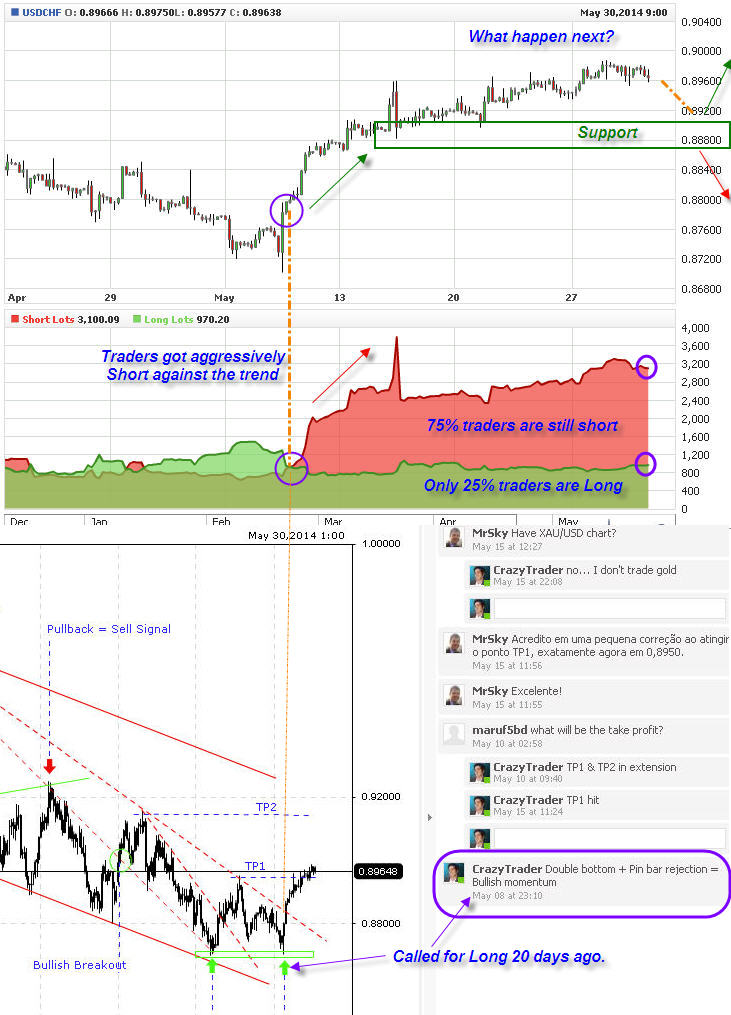
It's funny and paradoxal. I trade the trend and I'm a contrarian in the same time as 75% traders are short.
附件:
May 31, 2014 at 16:58
(已編輯May 31, 2014 at 17:07)
Well, USDCHF found resistance at the SMA200 (day chart) and formed a nice red bar on Friday. In hourly chart price clearly broke SMA200 support, retraced back to SMA200 and closed below it.
I further predict that it will continue to fall during the comming week and my next targets would be the SMA200 in 4-hours chart and the Ichimoku cloud / 50%-Fibo in day chart.
CrazyTrader, you said you don't trade in low time frames and that you follow the trend. But if you open weekly chart and monthly chart, you will see that USDCHF is in strong downtrend!
會員從Nov 21, 2011開始
1601帖子
May 31, 2014 at 17:22
KayS posted:
CrazyTrader, you said you don't trade in low time frames and that you follow the trend. But if you open weekly chart and monthly chart, you will see that USDCHF is in strong downtrend!
That is correct and the daily chart above shows that bearish trend. Sell signal has now been provided by market breaking down 0.8950 as mentionned above.
However, this pair seems to developp a stronger bullish move. Only a daily close below 0.8800 would cancel this outlook.
會員從Nov 21, 2011開始
1601帖子
Jun 02, 2014 at 09:04
CrazyTrader posted:KayS posted:
However, this pair seems to developp a stronger bullish move. Only a daily close below 0.8800 would cancel this outlook.
I vounched for you for your trading style description: "Specializing in trend-following price breakouts with a strong rise in volume (momentum)..." => Keep following the trend... not only for 2 hours.
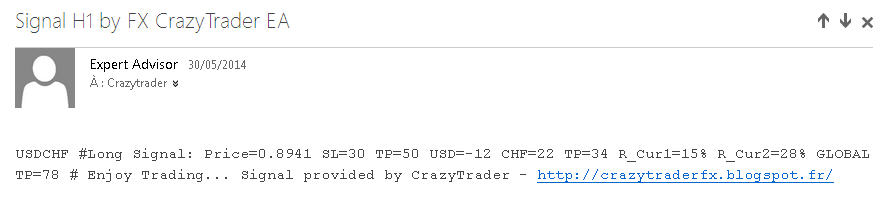
My followers are about to close 50 pips on being Long USDCHF @ 0.8941 from last friday: (Signal received by email)
=> If anyone interested... Check out my blog.
附件:
會員從Nov 21, 2011開始
1601帖子
Jun 02, 2014 at 16:39
Target hit.
會員從Nov 21, 2011開始
1601帖子
Jun 05, 2014 at 14:06
When I talked about a stronger move higher... You see what I meant now.

*商業用途和垃圾郵件將不被容忍,並可能導致帳戶終止。
提示:發佈圖片/YouTube網址會自動嵌入到您的帖子中!
提示:鍵入@符號,自動完成參與此討論的用戶名。


