GBP/USD 1H Chart – June 9, 2025

GBP/USD 1H Chart – June 9, 2025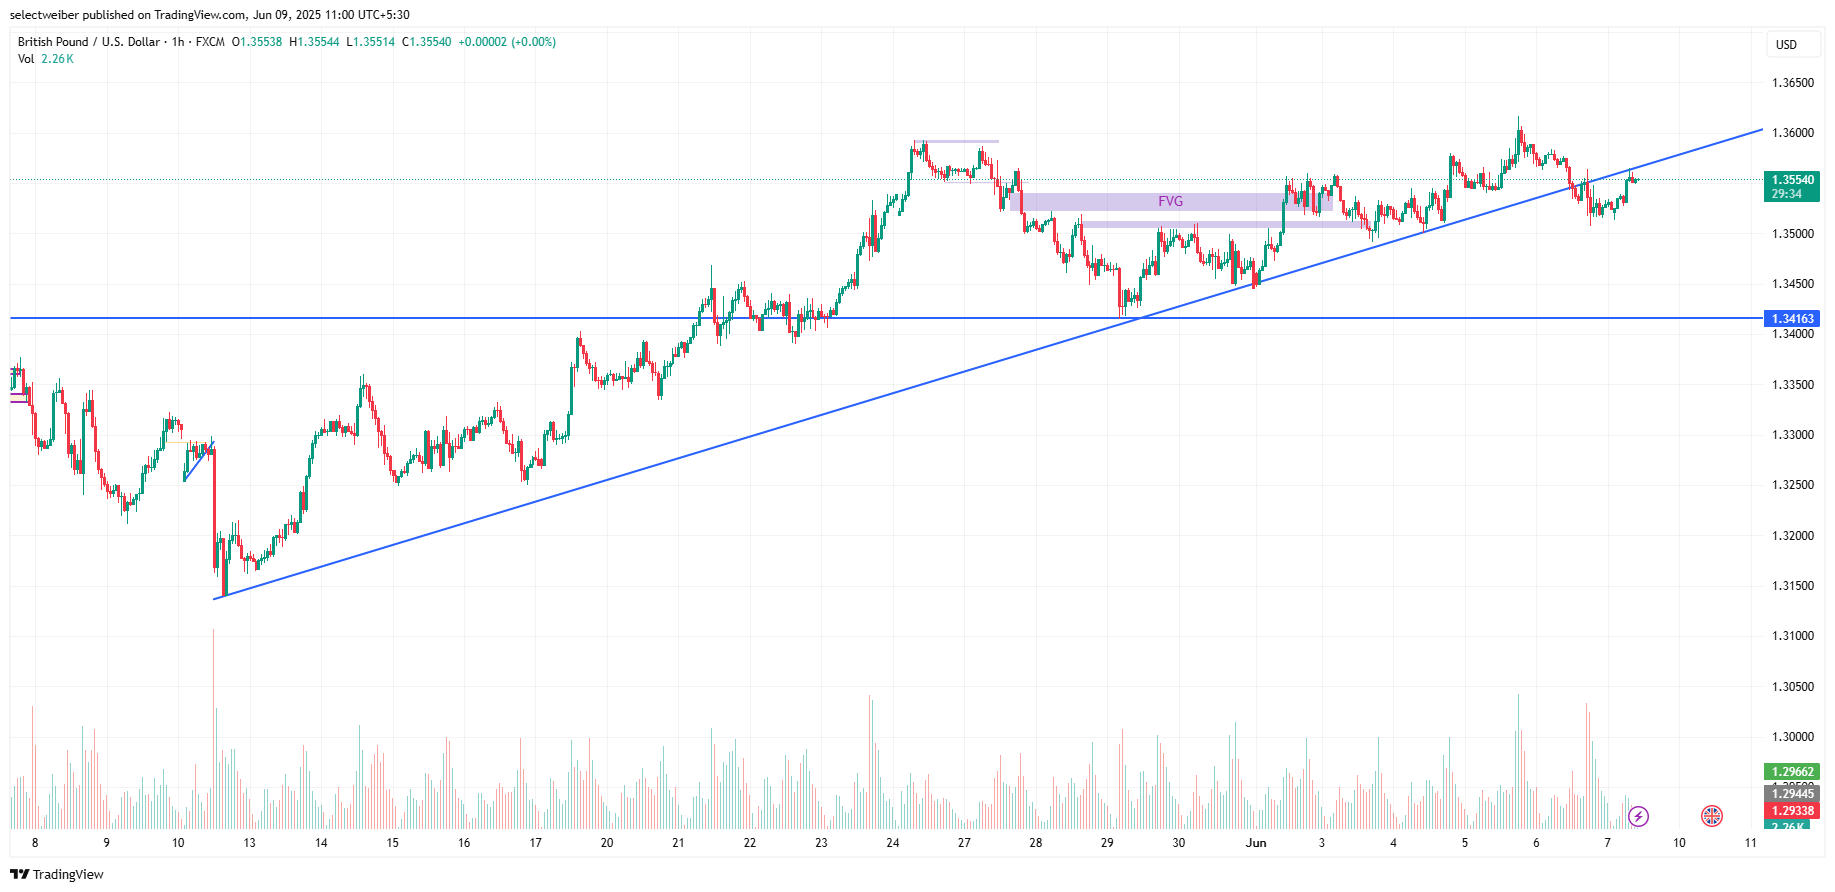
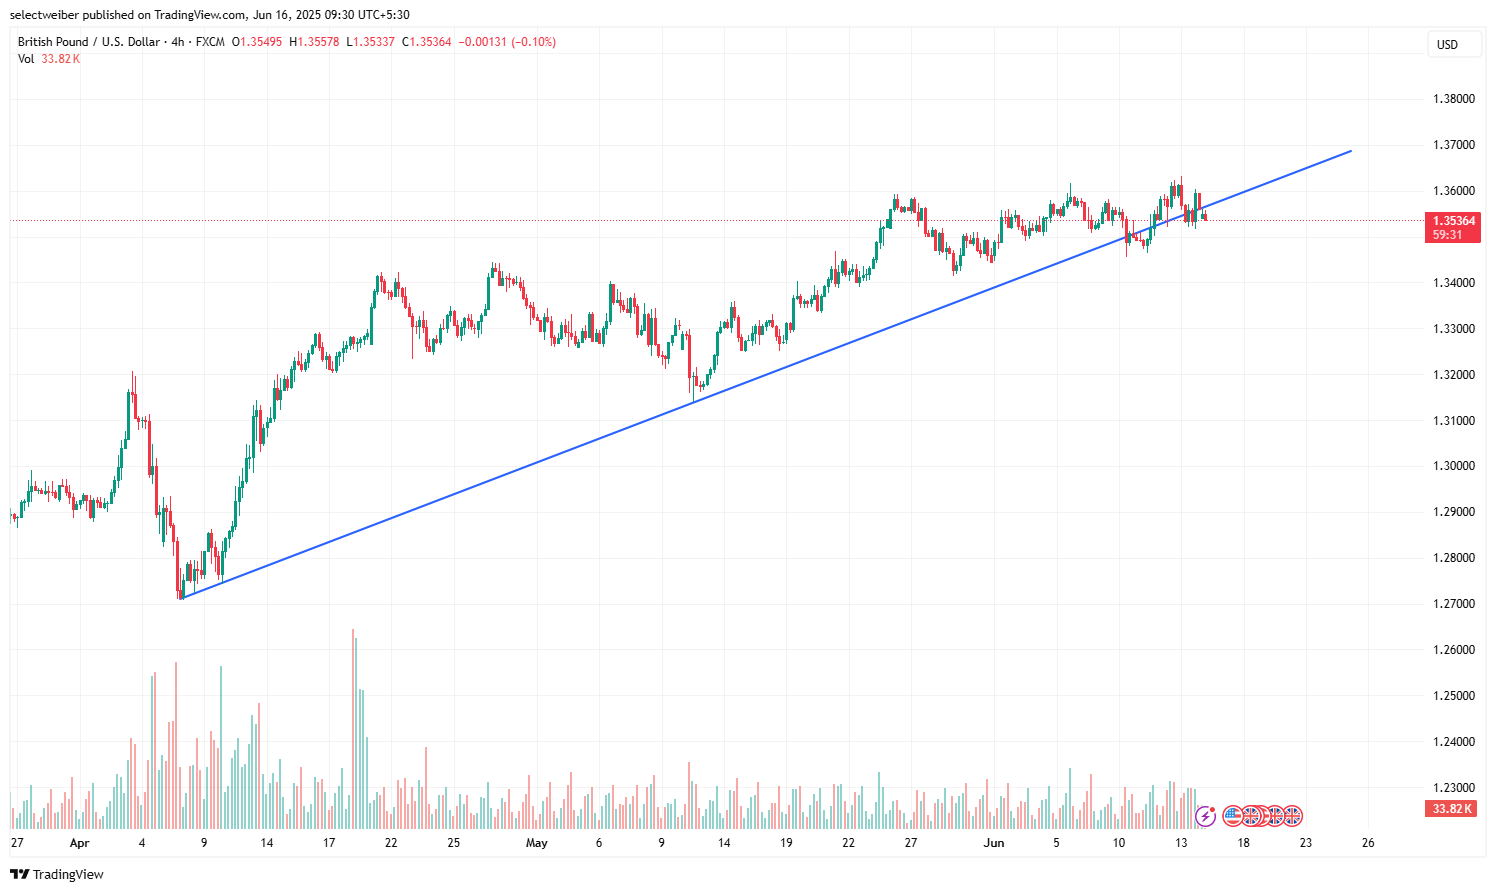
GBP/USD has been respecting an ascending trendline, maintaining a clear bullish structure. After rejecting near the 1.3600 area, price pulled back and retested the trendline, which also aligns with a fair value gap (FVG) zone.
Price is now showing signs of recovery, trading back above the trendline. If this structure holds, the next target could be a retest of the 1.3600 zone. A break below 1.3500 would invalidate the bullish structure and open the path to 1.3416 support.
Key levels:
Resistance: 1.3600Support: 1.3500 and 1.3416Waiting for confirmation on the lower timeframes before considering a long setup. Watching price action closely around current levels.

You can learn a lot about GBP/USD from this analysis. It highlights how price respects key technical structures like an ascending trendline and how market reactions around major levels—like 1.3600 and 1.3500—can guide trading decisions. The mention of a fair value gap (FVG) adds an extra layer of confluence, showing how institutional trading concepts can align with price action.
By studying this setup, you’ll understand the importance of:
Trend structure and how to identify a bullish or bearish biasSupport and resistance zones and their role in trade planningRisk management, especially by recognizing invalidation points like a break below 1.3500Waiting for confirmation on lower timeframes before entering a tradeIt’s a great example of how to approach a forex pair with a strategic, technical mindset.
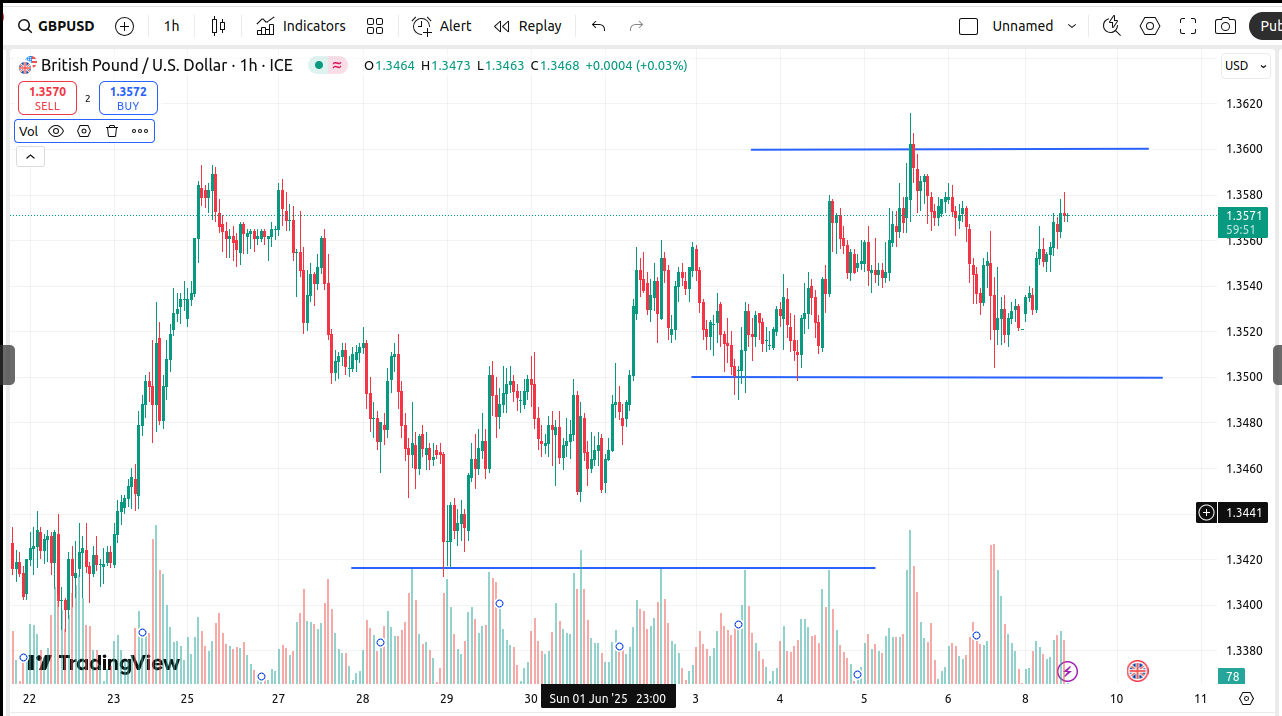
Price continues to trade within a clear range between 1.3500 support and 1.3600 resistance. After bouncing from the lower end, it's now pushing toward the top of the range.As long as 1.3500 holds, the bias remains slightly bullish. A clean breakout above 1.3600 could open further upside. However, until that happens, this remains a range-bound market.

Analyzing the GBP/USD 1-hour chart can offer key insights into short-term market trends, but making the right moves often requires more than just technical analysis. Thanks to Ivy Klementich’s invaluable trading signals, my journey in Bitcoin investment has taken a remarkable turn. Watching my portfolio grow from 152,601 to an incredible 487,079 is a true testament to her expertise and precision. If you’re looking to elevate your trading results—whether in Forex or crypto—connect with her on Telegrams at IvyKlementich and unlock your full potential today!