


Advertisement
Risk Management Made Easy

forex_trader_43716
Member Since Aug 06, 2011
326 posts
Jan 07, 2015 at 02:08
Never risk more than 2% equity on a single trade
Cut your losses short and let your profits run
Only trade positions with a 1:3 risk/reward ratio or better
Golden rules abound in this industry, and everyone seems to know the rules.
But who knows how to apply them?
How do you determine in advance if a trade will, in fact, deliver a 1:3 risk/reward ratio? At what point should you cut a loss short?
Unless you know how your strategy is performing, you can’t answer these questions. So may I suggest that instead of focusing on what you want your account to do, you should focus on what your account is doing?
Proper account analysis, performed on a trade-by-trade basis, has the power to reveal all. It will answer these questions:
What is the win/lose ratio for your strategy?
What is your risk/reward ratio?
What is your Longest Losing Streak (LLS)?
What is your Largest Losing Trade (LLT)?
The answers to these questions will put you in control.
I am assuming at this point that you have back-tested your strategy over at least the past 12-month period, and that you have historical account data for the back-test period. If not, guess what you’re doing next? Back-testing!
Calculations
Win/Lose Ratio: Number of Winning Trades / Total Number of Trades x 100 calculates your win (Win%) percentage. 100 – Win% calculates your lose (Lose%) percentage. Win% / Lose% calculates the number of winning trades per losing trade, the win/lose ratio. A 2:1 win/lose ratio means 2 winning trades for each losing trade.
Risk/Reward Ratio: Total Profit on Winning Trades / Total Loss on Losing Trades calculates your risk/reward ratio. A 1:3 risk/reward ratio means you earned $3.00 for each $1.00 lost.
Longest Losing Streak (LLS): Largest Number of Losing Trades in a row over the historical trading period. Total value of these losing trades tells you the dollar amount of risk your trading capital must be able to absorb to survive.
Largest Losing Trade (LLT): Largest Losing Trade over the historical trading period. Like your LLS, the value of the LLT tells you the dollar amount of risk your trading must be able to absorb to survive.
Application
I let my account performance tell me if I am doing it right, or doing it wrong. I use the results to tell me what to do next. It’s not complicated.
If I want to achieve a 1:3 risk/reward ratio, but I am getting only 1:2, then either my risk is too high, or my reward is too low. Either way, I need to review my strategy and amend it accordingly. If I am getting 1:3 or better I can do nothing, or I can consider lifting my risk a little to optimize future earnings performance.
If I want a 2:1 win/lose ratio, but I am getting only 1:1, then there is a problem with my entry/exit timing. I need to review my strategy and amend it accordingly. If I am getting 2:1 or better I can do nothing, or I can sharpen my entry/exit standards to optimize future earnings performance.
If I want to know how much capital I need to survive over a period of adverse trading conditions, I can use the combined value of the Longest Losing Streak (LLS) and the Largest Losing Trade (LLT) to give me a reasonably precise answer.
Case Study
In 2014, starting with $10,000 capital and trading 1 x Standard Lot ($100,000 USD), the MYFXPT Trading Strategy made 65 trades. Of these there were 42 winners (64%), 21 losers (32%), and 2 breakeven trades(4%). This gives the strategy a 2:1 win/lose ratio, so on average, for every 3 trades we win on 2 and lose on 1, which is a reasonable batting average. More enlightening, however, is the dollar value of winning and losing trades. (view results)
Losing trades totaled $11,996, an average $571 loss per losing trade, or a 5.71% risk factor. Our 42 winning trades produced a profit of $104,965, or an average $2,499 profit per winning trade. Hence, the strategy generated a risk/reward ratio of 1:4.87, which is above average.
We could conclude from these results that our strategy offers excellent potential, but these results tell us nothing about long-term survivability.
The number one objective of risk management is to survive a period of adverse trading conditions. For example, whilst a 1:4.87 risk/reward ratio and a 2:1 win/lose ratio look good in theory, would the account have survived if it had suffered those 21 losing trades in a row, starting with the very first trade? The answer is a resounding NO. We started with $10,000 and lost $11,996...we're gone!
Knowing the Longest Losing Streak (LLS) of your strategy is critical to survival planning. In our case the LLS is 3 losing trades in a row between 20th August and 8th September 2014. Those 3 losing trades generated a $2,252 total loss, or an average $750 per losing trade. Hence, in our case $10,000 start capital is more than adequate to absorb the LLS without blowing the account. Drawdown was 22.52% over the historical trading period.
This is important. If our objective is to limit account drawdown to 50% of account funds, and our LLS is $2,252, then we need $4,504 minimum start capital ($4,504 x 50% = $2,252). If we don't have $4,504 in start capital, but we are comfortable accepting 75% drawdown, we can reduce start capital to $3,002 ($3,002 x 75% = $2,252). At the other end of the scale, if we want to be extra safe and accept no more than 20% drawdown, we will need to increase start capital to $11,260 ($11,260 x 20% = $2,252). So knowing the LLS puts you in control of managing capital needed to survive adverse conditions ahead of time.
There is one final piece of information that is critical to survival, and that is the Largest Losing Trade (LLT) that occurred over the historical trading period. In our case we had a $2,310 LLT on 18th February 2014, and of course, we can employ the same drawdown analysis to ensure account survival, but the question remains: what would have happened if we experienced this LLT within the LLS, or worse still, what if we had 3 of these LLT's in a row? Suddenly we are faced with the potential for a combined losing streak of $6,930 in total, or 69.3% drawdown.
What is the statistical probability?
We completed 65 trades over the historical trading period, incurring an LLS of $2,252 and an LLT of $2,310, so there is currently a 1 in 65 chance of this occurring again. That is, over the next 65 trades there is the chance of an approximate $2,300 loss occurring either from an LLS or LLT. If these were to occur together, our risk is $4,562 over the next 65 trades.
If we combine the two, and use this as the basis of our analysis, the probable risk is that the account would need to withstand a potential loss of $4,562 over 65 trades.
If we want to limit drawdown to 50% we need $9,124 start capital ($9,124 x 50% = $4,562). If we accept 75% drawdown we need $6,082 start capital ($6,082 x 75% = $4,562), but if we want to limit drawdown to 20% we need $22,810 start capital ($22,810 x 20% = $4,562). What if you don't have $22,810 capital? You can always reduce your lot size from Standard Lots ($100,000 USD contract) to Mini Lots ($10,000 USD contract), in which case $2,281 capital would be required, or trade in Micro Lots ($1,000 USD contract) with $228 capital. See how all this account analysis stuff puts you in control?
All you have to remember is this:
Account analysis is dynamic, and the results will change with each closed trade. It is important, then, that you conduct regular account analysis to keep your trading performance data up to date. The risk factor, win/lose ratio, risk/reward ratio, LLS, and LLT, can all change with each completed trade, so it is in your best interests to update data accordingly.
As you can appreciate, this brief outline is far from being a complete study of risk management. My purpose here is only to highlight to you the work that needs to be done behind the scenes to ensure that funds are kept as safe as possible, whilst maximising potential returns. This is a risky business we are in, and we will only ever have statistical probabilities to work with. Attention to detail and routine account analysis will ensure that the odds are always stacked in your favour.
forex_trader_43716
Member Since Aug 06, 2011
326 posts
Jan 07, 2015 at 20:07
Thank you...
forex_trader_43716
Member Since Aug 06, 2011
326 posts
Jan 08, 2015 at 09:49
Welcome...

forex_trader_43716
Member Since Aug 06, 2011
326 posts
Jan 08, 2015 at 20:13
You're welcome...

forex_trader_43716
Member Since Aug 06, 2011
326 posts
Jan 16, 2015 at 20:41
DrVodka posted:
AND u called this EASY ???😀😀😀
Thanks for the feedback, and thanks for your point of view. Sometimes the explanation is more complex than the subject, and risk management is one such subject. But in the end it all comes back to 4 pieces of information - win/lose ratio, risk/reward ratio, LLS, and LLT. This information is easy to come by through simple analysis of account performance...true? With this information in hand we can instantly determine if we are meeting our account objectives or not, and if not, what to do next.
My point here is to emphasize that risk management is less about following rules, and more about understanding what is actually happening with account performance. If, for example, we want our account to meet the 1:3 risk/reward ratio, and we are actually getting better than this, then we are meeting and going beyond our objective. If we are not meeting our objective then we have to do something...reduce risk or improve reward. It is this definite choice of action that makes risk management easy, just like a set of traffic lights where we go if green, stop if red, and do nothing if amber. That's management! 😎
forex_trader_43716
Member Since Aug 06, 2011
326 posts
Jan 16, 2015 at 21:02
If anyone has questions, just ask. 😎
Member Since Jun 09, 2014
134 posts
Jan 18, 2015 at 15:58
Hahaha. Awesome post.
Member Since Nov 23, 2014
1 posts
Jan 18, 2015 at 15:59
(edited Jan 18, 2015 at 16:23)
Excellent thread Garry, A well informed post on risk management if you don't have/understand this " failure is inevitable." I hope you don,t mind if I use your post for newbies in the market. I am tracking your live account and with your understanding of RM, I am sure you will be a successful trader.
forex_trader_43716
Member Since Aug 06, 2011
326 posts
Jan 19, 2015 at 10:12
Verisimilitude posted:
Excellent thread Garry, A well informed post on risk management if you don't have/understand this " failure is inevitable." I hope you don,t mind if I use your post for newbies in the market. I am tracking your live account and with your understanding of RM, I am sure you will be a successful trader.
Thank you! No problem using this post for newbies...that was the intention! 😎

Jan 23, 2015 at 00:13
Thank you very much for this post.
The conclusion is this:
Here in MyFxBook, in Advanced Statistics of each system, we can saw many data.
Profit factor is something that you called win/lose ratio right?
How about others 3 information?
How we can analyse them?
Very happy if you could give an example 😄
The conclusion is this:
myfxpt posted:
But in the end it all comes back to 4 pieces of information - win/lose ratio, risk/reward ratio, LLS, and LLT.
Here in MyFxBook, in Advanced Statistics of each system, we can saw many data.
Profit factor is something that you called win/lose ratio right?
How about others 3 information?
How we can analyse them?
Very happy if you could give an example 😄
forex_trader_43716
Member Since Aug 06, 2011
326 posts
Jan 23, 2015 at 22:20
Here in MyFxBook, in Advanced Statistics of each system, we can saw many data.
Profit factor is something that you called win/lose ratio right?
How about others 3 information?
How we can analyse them?
Very happy if you could give an example 😄
Thanks for your feedback.
Actually, the Profit Factor is the risk/reward ratio, and the win/lose ratio is the number of winning trades as opposed to the number of losing trades. If you divide the number of winning trades by the number of losing trades, this is your win/lose ratio.
Finding the Longest Losing Streak (LLS) is simply a matter of going over your trade history to find groups of losing trades clustered together. You are looking for the longest streak of consecutive losing trades, and calculating their combined value. The Largest Losing Trade (LLT) is the largest losing trade incurred over your trade history.
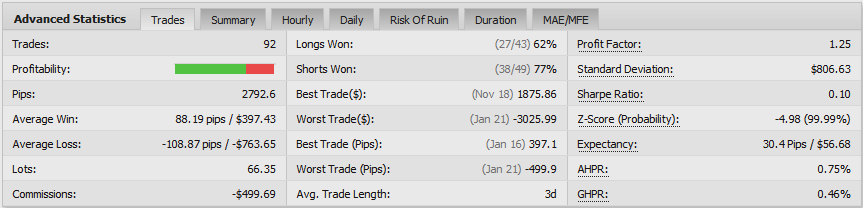
WIN/LOSE RATIO:
“Trades” shows the total number of trades made, which is 92 in the example above. “Longs Won” and “Shorts Won” shows total number of Long (27) and Short (38) winning trades, which if added together (65) and subtracted from the total of 92 trades, shows that there were 27 losing trades. Divide winning trades (65) by losing trades (27) and the win/lose ratio is 2.4:1, or 2.4 winning trades to each losing trade.
RISK/REWARD RATIO:
You can divide the gross profit (total winning trade profit) by the gross loss (total losing trade loss) to calculate the risk/reward ratio. This same value is expressed as the Profit Factor, which in the above example is 1.25, or a risk/reward ratio of 1:1.25. That is, this account earns $1.25 for each $1.00 lost.
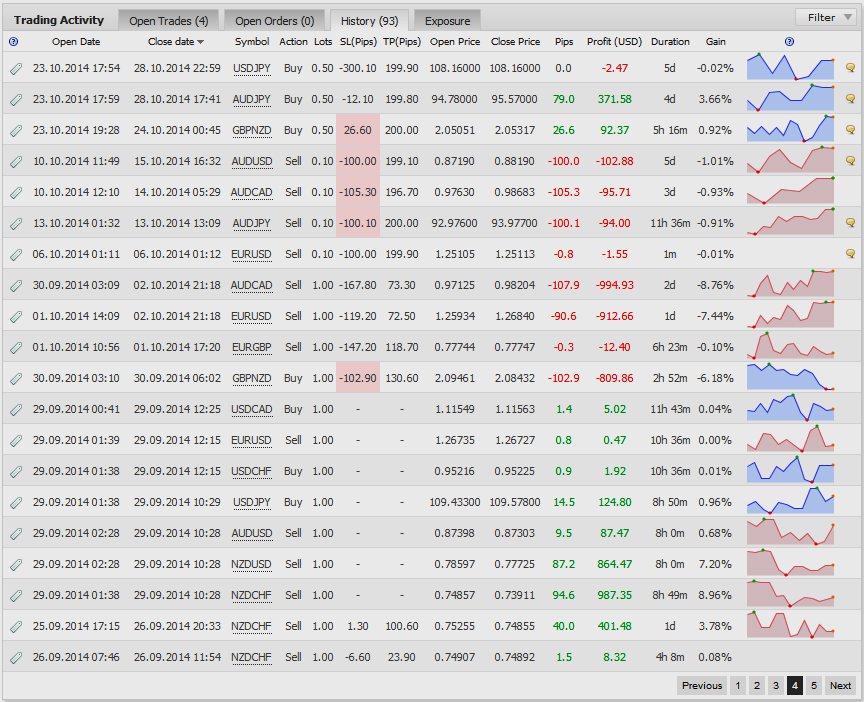
LONGEST LOSING STREAK:
In the example above there are 8 losing trades in a row, generating a combined loss of $2,111.33. You would need to examine the entire trade history to find the LLS, but this example clarifies what you are looking for.
LARGEST LOSING TRADE:
The LLT in this example is $994.93 incurred on 2nd October 2014.
Using my example, if you wanted to limit drawdown to 50% of account balance, you would add $994.93 to $2,111.33, for $3,106.26 x 2 = $6,2125.52 capital required.
Trust this helps, but please keep the questions coming.
Cheers 😎
Jan 25, 2015 at 16:06
Thank you very much for this example. My understanding on LLS and LLT was became better.
BabyPips explained about risk/reward ratio in
https://www.babypips.com/school/undergraduate/senior-year/risk-management/reward-to-risk-ratio.html.
An example that was given is this.
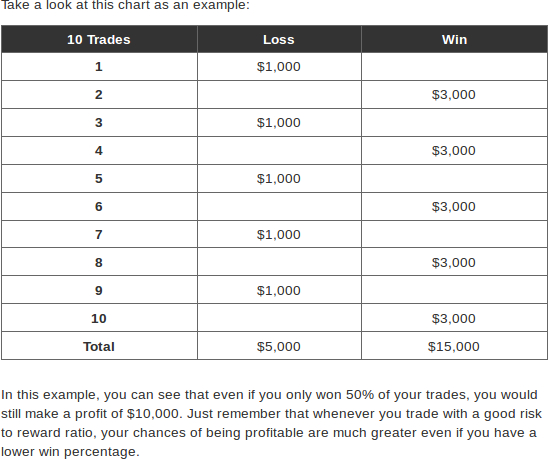
BabyPips explained that although we only win in 50% of trades, that it's mean 1:1 of win/lose ratio, we still in profit at the end because we use 1:3 of risk/reward ratio.
Base on this example, I think risk/reward ratio is more important. So, I think we must give more attention to it.
What do you think?
BabyPips explained about risk/reward ratio in
https://www.babypips.com/school/undergraduate/senior-year/risk-management/reward-to-risk-ratio.html.
An example that was given is this.
BabyPips explained that although we only win in 50% of trades, that it's mean 1:1 of win/lose ratio, we still in profit at the end because we use 1:3 of risk/reward ratio.
Base on this example, I think risk/reward ratio is more important. So, I think we must give more attention to it.
What do you think?
Attachments:
forex_trader_43716
Member Since Aug 06, 2011
326 posts
Jan 25, 2015 at 21:25
Hi TakeIt
Absolutely agree! When I traded Bank Bill Futures back in the 80s, I won just 3 out of 10 trades. My average win trade made around $250, whilst my average losing trade lost $50, so my risk/reward was 1:5, and my profit was around $400 over ten trades.
The biggest problem we all face is to determine the potential risk/reward in advance of making a trade. Some traders use Fibo lines, others use S/R lines, and both provide a good guess. But the only real way to learn about your risk/reward is when you close the trade. Hence, this is why I choose regular account analysis to see how my strategy is performing. If my risk/reward is declining my strategy needs attention...less risk or greater reward.
Really good to see you looking at BabyPips...excellent place for all of us to refresh our knowledge! 😎
Member Since Jan 22, 2015
57 posts
Jan 26, 2015 at 07:41
I like the BabyPips chart, but, honestly, who wins 50%? Though that chart would hold good even at a 30% win ratio, though it would be 7k loss 9k gain. I would still be happy with that. And its probably a much more realistic win ratio.


