


Advertisement
DRFX TRADING SERVICE 2016 (By DRFXTRADING )
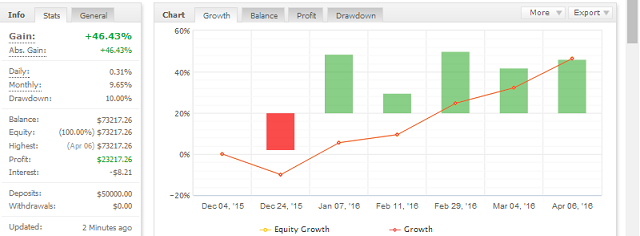
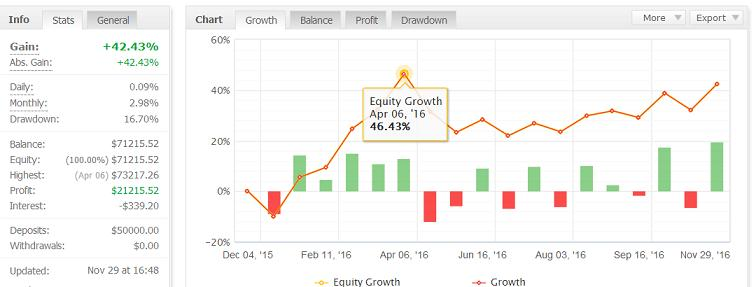
| Gain : | +42.43% |
| Drawdown | 16.70% |
| Pips: | 786.0 |
| Trades | 18 |
| Won: |
|
| Lost: |
|
| Type: | Demo |
| Leverage: | 1:100 |
| Trading: | Manual |
DRFX TRADING SERVICE 2016 Discussion
Feb 12, 2016 at 01:56
1,033 Views
9 Replies

Member Since Nov 19, 2014
157 posts
Mar 02, 2016 at 17:00
(edited Mar 02, 2016 at 17:16)
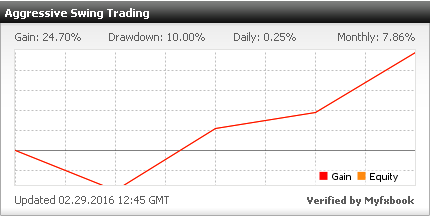
This System is based on 4 Swing Trading Strategies that target gains of 100 to 200 Pips Per Trade.
System uses the Candlesticks Signals and Patterns of the Daily and 4 Hour Charts for Entry and Exit, which are more reliable than those of the Lower Time Frames.
Holding Periods for each trade depend on the Strategy being used, but they are between 4 to 7 Days.
The goal is to show how Swing Trading is a more reliable and sustainable approach to Forex Trading over the long-term, especially when we target the best setups offered by the market each week.
This is a more aggressive version of the previous System that generated 40% in 7 Months.
https://www.myfxbook.com/portfolio/conservative-swing-trading/1079693
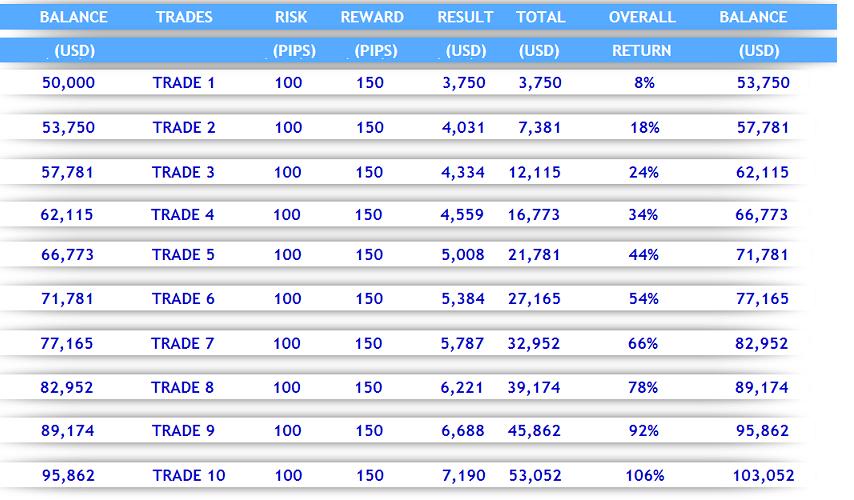
Although this was good for the conservative trader, the current version offers a faster Rate of Return in a much shorter time period. With this approach, the following targets are expected to be hit in the next few weeks and months.
1. 100% Rate of Return (March 30th, 2016)
2. 200% Rate of Return (April 30th, 2016)
3. 500% Rate of Return (May 30th, 2016)
4. 1000% Rate of Return (June 30th, 2016)
By targeting the best setups that bypass Intra-Day Volatility, Swing Trading can continue to provide the best approach to Short and Long-Term Wealth.
Questions, Comments and Interest in using this system are welcome.
Duane
DRFXSWINGTRADING

System uses the Candlesticks Signals and Patterns of the Daily and 4 Hour Charts for Entry and Exit, which are more reliable than those of the Lower Time Frames.
Holding Periods for each trade depend on the Strategy being used, but they are between 4 to 7 Days.
The goal is to show how Swing Trading is a more reliable and sustainable approach to Forex Trading over the long-term, especially when we target the best setups offered by the market each week.
This is a more aggressive version of the previous System that generated 40% in 7 Months.
https://www.myfxbook.com/portfolio/conservative-swing-trading/1079693
Although this was good for the conservative trader, the current version offers a faster Rate of Return in a much shorter time period. With this approach, the following targets are expected to be hit in the next few weeks and months.
1. 100% Rate of Return (March 30th, 2016)
2. 200% Rate of Return (April 30th, 2016)
3. 500% Rate of Return (May 30th, 2016)
4. 1000% Rate of Return (June 30th, 2016)
By targeting the best setups that bypass Intra-Day Volatility, Swing Trading can continue to provide the best approach to Short and Long-Term Wealth.
Questions, Comments and Interest in using this system are welcome.
Duane
DRFXSWINGTRADING
Attachments:
Trade Less, Earn More
Member Since Nov 19, 2014
157 posts
Mar 02, 2016 at 17:05
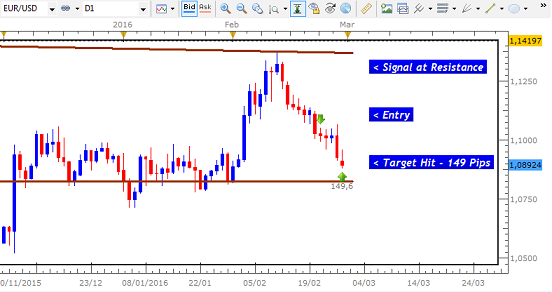
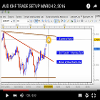
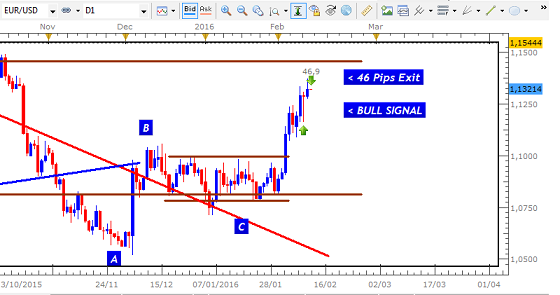
Latest trade gave us a 149 Pip gain on the EURO USD as it headed to Support of Pennant on Daily Chart.
This was the overall setup as seen in this chart and the Video Analysis
/FEB_4_2016__EURO_USD_4H_ENTRY_SETUP_Bn.png" target="_blank" rel="noopener noreferrer nofollow">
After a few days, target was hit.
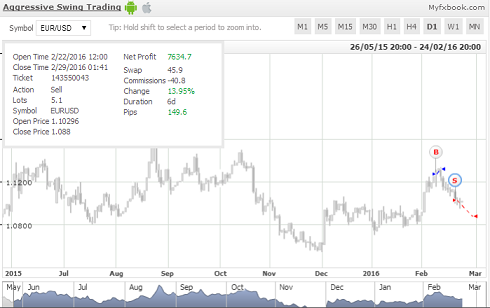
Overall, Return from these Strategies is now 25%
This trade continues to show how we can better results by focusing on the larger time frames. These offer larger movements and more reliable signals to take advantage of these trends.
Stop Losses should be placed at areas that will protect trades against temporary pullbacks before our targets are hit. Support and Resistance and Trend Lines - once strong enough - great places for Stop Losses.
MAIN TECHNICAL HIGHLIGHTS OF TRADE
- Trading Within Consolidations
- Using Strong Daily Candle Signals
- Using Strong Stop Loss Areas on the 4 Hour Chart
- Waiting Patiently Until Target is Hit
- Strong Gains Possible with Swing Trading
Regards
Duane
DRFXSWINGTRADING
Attachments:

Trade Less, Earn More
Member Since Nov 19, 2014
157 posts
Mar 10, 2016 at 04:50
How goes it traders?
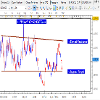
Another good trade made, AUD CHF, 108 Pips.
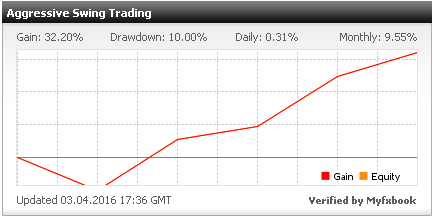
Return now up to 32% from just 4 trades, 2 Months, targeting 100% within next couple of weeks.
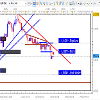
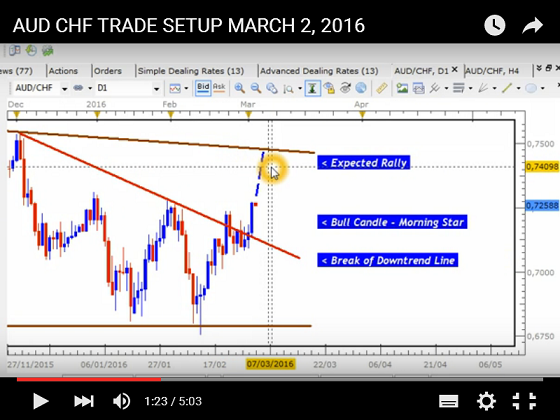
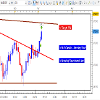
Setup for the trade was the Bullish Trend within a Large Pennant on the Daily Chart, that was taking us to the Resistance Boundary.
The Signal to get things going was that Morning Star Candlestick Formation above the broken Downtrend Line.
/MARCH_1_2016_AUD_CHF_4H_ENTRY_SETUP.png" target="_blank" rel="noopener noreferrer nofollow"> /MARCH_1_2016_AUD_CHF_4H_ENTRY_SETUP.png"/>
By Friday, 2 Days later, target was hit.
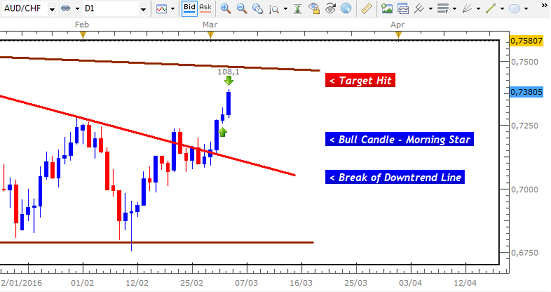
/MARCH_1_2016_AUD_CHF_MYFXBOOK_TRADE.png" target="_blank" rel="noopener noreferrer nofollow">/MARCH_1_2016_AUD_CHF_MYFXBOOK_TRADE.png"/>
This was a very short trade compared to the others that tend to last between 3 and 5 Days.
Trades within Consolidations of the size can be extremely profitable given the wide distance between Support and Resistance. Key is to spot the signals in time - THE CORRECT SIGNALS - make sure that setup meets our/your trading rules, then trade it. However, the challenge can be the time to hold these trades, ranging from 4- 7 Days on average for these size Consolidations in most cases, so I was fortunate that this just took 2 days.
Other highlights
- Bullish Candlestick Signals (Morning Star)
- Double Bottoms (see Video)
- Breaks of Downtrend Lines
- Resistance
Duane
DRFXTRADING


Another good trade made, AUD CHF, 108 Pips.
Return now up to 32% from just 4 trades, 2 Months, targeting 100% within next couple of weeks.
Setup for the trade was the Bullish Trend within a Large Pennant on the Daily Chart, that was taking us to the Resistance Boundary.
The Signal to get things going was that Morning Star Candlestick Formation above the broken Downtrend Line.
/MARCH_1_2016_AUD_CHF_4H_ENTRY_SETUP.png" target="_blank" rel="noopener noreferrer nofollow">
By Friday, 2 Days later, target was hit.
/MARCH_1_2016_AUD_CHF_MYFXBOOK_TRADE.png" target="_blank" rel="noopener noreferrer nofollow">
This was a very short trade compared to the others that tend to last between 3 and 5 Days.
Trades within Consolidations of the size can be extremely profitable given the wide distance between Support and Resistance. Key is to spot the signals in time - THE CORRECT SIGNALS - make sure that setup meets our/your trading rules, then trade it. However, the challenge can be the time to hold these trades, ranging from 4- 7 Days on average for these size Consolidations in most cases, so I was fortunate that this just took 2 days.
Other highlights
- Bullish Candlestick Signals (Morning Star)
- Double Bottoms (see Video)
- Breaks of Downtrend Lines
- Resistance
Duane
DRFXTRADING
Attachments:
Trade Less, Earn More

Member Since Jan 05, 2016
1097 posts
Mar 10, 2016 at 06:37
Where is your LIVE account? You are using a demo account as proof your system works.
Also, your demo shows it is for trade station.
Explain yourself.

Also, your demo shows it is for trade station.
Explain yourself.
If it looks too good to be true, it's probably a scam! Let the buyer beware.
Member Since Jan 05, 2016
1097 posts
Mar 10, 2016 at 06:42
Explain yourself. Your data does not match the images you posted.
This appears to be yet another scam.

This appears to be yet another scam.
If it looks too good to be true, it's probably a scam! Let the buyer beware.
Member Since Nov 19, 2014
157 posts
Mar 10, 2016 at 07:18
(edited Mar 10, 2016 at 07:21)
Hey man, thanks for the questions/concerns
Not sure I understand the first question. Yes that 1st System was a Demo FXCM. ahm..not sure the concern.
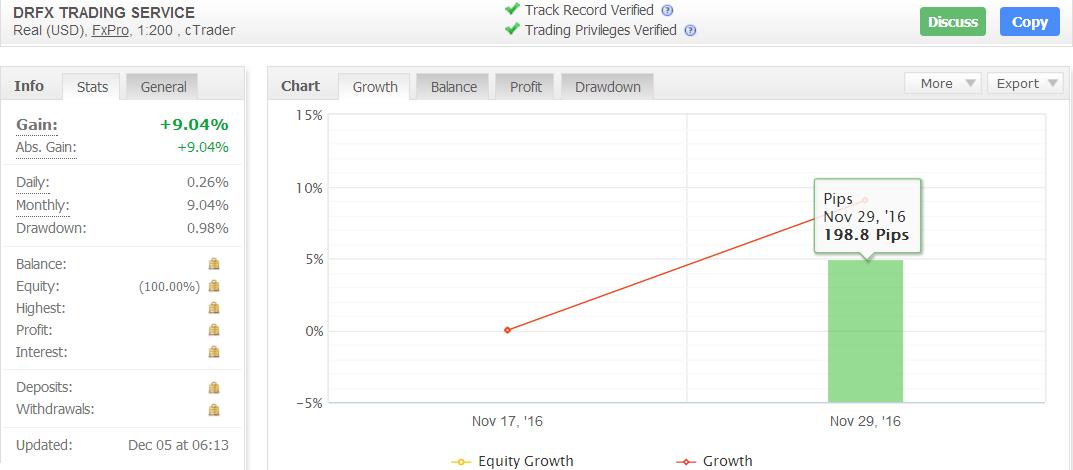
As you would have seen in the early parts of my thread for that system, my Live Account is at Dukascopy. I explained that the JFOREX platform of Dukascopy CANNOT be tracked/linked to Myfxbook..something to do with the API. I tried linking it to another website that tracks trading results but no luck either.
That was why, for each of the Demo trades made on that system, I posted a picture of my Live Account to show that the system reflected what was taking place on my Live Account. Take a look you will see.
In the near future, I may add another Live Account at a broker/platform that can be tracked...ex FXCM..but I been with Dukascopy since 2011, no problems with them at all..so I wouldnt want to switch just to show my Live Account here.
2nd question. Scam? Youre the first to make that comment. No Scam.
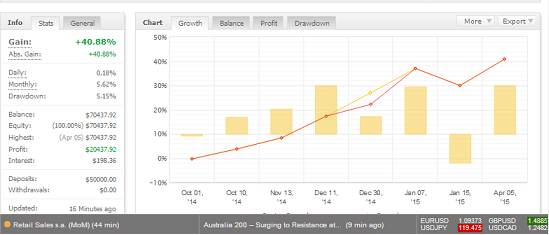
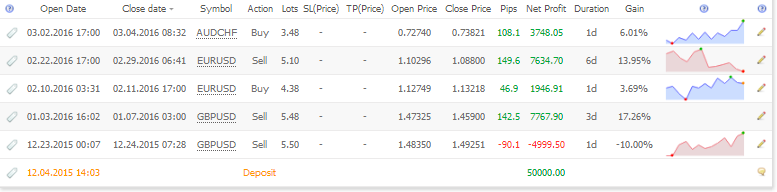
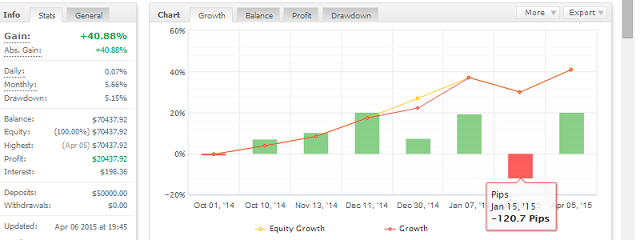
The difference between the 2 graphs is that the green bars represent the lots used per trade and the graph with the yellow bars represent gains/losses in Pips. Use your cursor to hover over them.
Hope that answers your questions...let me know
Duane
DRFXTRADING
Not sure I understand the first question. Yes that 1st System was a Demo FXCM. ahm..not sure the concern.
As you would have seen in the early parts of my thread for that system, my Live Account is at Dukascopy. I explained that the JFOREX platform of Dukascopy CANNOT be tracked/linked to Myfxbook..something to do with the API. I tried linking it to another website that tracks trading results but no luck either.
That was why, for each of the Demo trades made on that system, I posted a picture of my Live Account to show that the system reflected what was taking place on my Live Account. Take a look you will see.
In the near future, I may add another Live Account at a broker/platform that can be tracked...ex FXCM..but I been with Dukascopy since 2011, no problems with them at all..so I wouldnt want to switch just to show my Live Account here.
2nd question. Scam? Youre the first to make that comment. No Scam.
The difference between the 2 graphs is that the green bars represent the lots used per trade and the graph with the yellow bars represent gains/losses in Pips. Use your cursor to hover over them.
Hope that answers your questions...let me know
Duane
DRFXTRADING
Trade Less, Earn More
Member Since Nov 19, 2014
157 posts
Mar 10, 2016 at 07:32
(edited Mar 10, 2016 at 07:33)
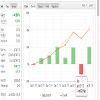
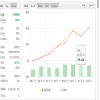
This is showing Pips
Thi showing lots

Attachments:
Trade Less, Earn More
Member Since Nov 19, 2014
157 posts
Mar 14, 2016 at 01:57
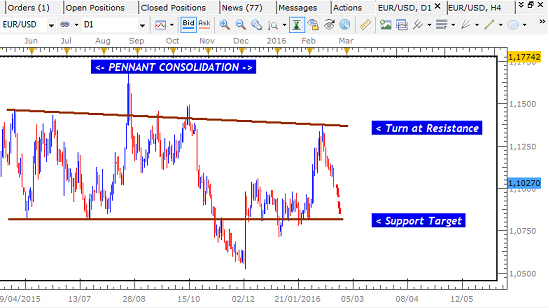
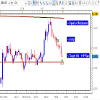
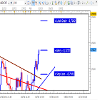
This EURO bad boy been in a Pennant for quite awhile..Daily Chart..
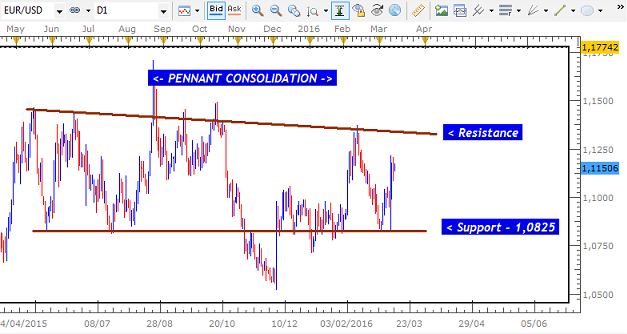
This explains most of the crazy **** moves that been happeniing over the last several months, like that on Thursday.
Even though it was set off by the ECB action, these setups often have these erratic moves as they move from Support to Resistance.
I was actually getting ready to trade this bullish, expecting one of 3 possible Signals...
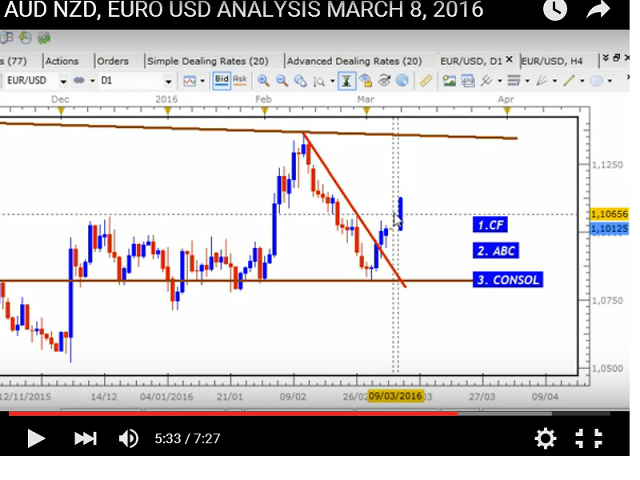
/FEB_4_2016__EURO_USD_DAILY_149_PIPS_Z0.png" target="_blank" rel="noopener noreferrer nofollow">/FEB_4_2016__EURO_USD_DAILY_149_PIPS_Z0.png"/>
Sometimes these setups can lead to losses with these types of news etc., but sometimes when you catch them at the right time with the right setup..can take our pound of flesh from them
Duane
DRFXTRADING
This explains most of the crazy **** moves that been happeniing over the last several months, like that on Thursday.
Even though it was set off by the ECB action, these setups often have these erratic moves as they move from Support to Resistance.
I was actually getting ready to trade this bullish, expecting one of 3 possible Signals...
/FEB_4_2016__EURO_USD_DAILY_149_PIPS_Z0.png" target="_blank" rel="noopener noreferrer nofollow">
Sometimes these setups can lead to losses with these types of news etc., but sometimes when you catch them at the right time with the right setup..can take our pound of flesh from them
Duane
DRFXTRADING
Trade Less, Earn More
Member Since Nov 19, 2014
157 posts
Apr 06, 2016 at 09:12
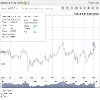
Latest trade, 130 Pips GBP USD
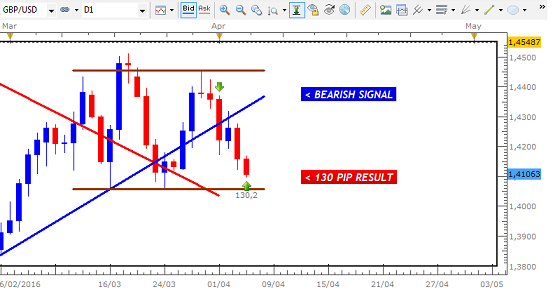
Slow and Steady Wins The Race.
Details Later
Attachments:


Trade Less, Earn More


*Commercial use and spam will not be tolerated, and may result in account termination.
Tip: Posting an image/youtube url will automatically embed it in your post!
Tip: Type the @ sign to auto complete a username participating in this discussion.


