


Advertisement
Swing Trading Part 2 (による DRFXTRADING )
そのユーザーはこのシステムを削除しました。
Swing Trading Part 2 討論
Aug 08, 2015 at 17:31
625 視聴
3 Replies

Nov 19, 2014からメンバー
157 投稿
Aug 08, 2015 at 18:36
This System is a continuation of the one started on Swing Trading Part 1. https://www.myfxbook.com/members/DRFXTRADING/swing-trading-part-1/1079693
As with Part 1, the focus here is to generate consistent and stable returns over the Long-Term by targeting the best trading opportunities of between 100 and 200 Pips each month. The Risk Per Trade used in the system is 5%, but naturally, anyone who uses it is free to apply the Risk that is consistent with their personal Risk Tolerance.
The system has had a little bit of bad luck with the last 3 trades being losing ones. Nevertheless, when combined, the Rate of Return from all trades so far have led to a good performance in a relative short time.
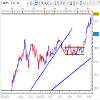
USD JPY
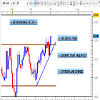
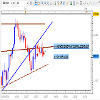
This was thought to be breaking Bullish from a Large Consolidation, but instead, the market pulled back bearish, leading to the loss.
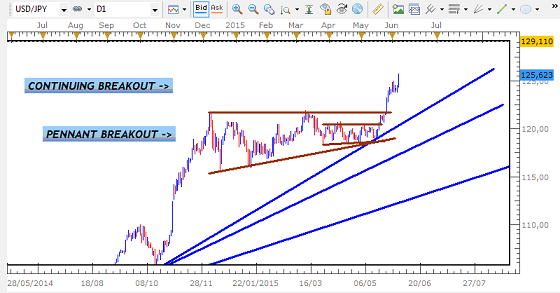
Unfortunately, this was not a Large Consolidation as I had thought. The only Consolidation was the Range Setup and I was actually entering at the end of the breakout from this setup just ahead of the pullback that takes place when these breakouts end...
As a result, the market pulled back to take out the Stop Loss.
As with Part 1, the focus here is to generate consistent and stable returns over the Long-Term by targeting the best trading opportunities of between 100 and 200 Pips each month. The Risk Per Trade used in the system is 5%, but naturally, anyone who uses it is free to apply the Risk that is consistent with their personal Risk Tolerance.
The system has had a little bit of bad luck with the last 3 trades being losing ones. Nevertheless, when combined, the Rate of Return from all trades so far have led to a good performance in a relative short time.
USD JPY
This was thought to be breaking Bullish from a Large Consolidation, but instead, the market pulled back bearish, leading to the loss.
Unfortunately, this was not a Large Consolidation as I had thought. The only Consolidation was the Range Setup and I was actually entering at the end of the breakout from this setup just ahead of the pullback that takes place when these breakouts end...
As a result, the market pulled back to take out the Stop Loss.
付属品:
Trade Less, Earn More
Nov 19, 2014からメンバー
157 投稿
Aug 08, 2015 at 18:52
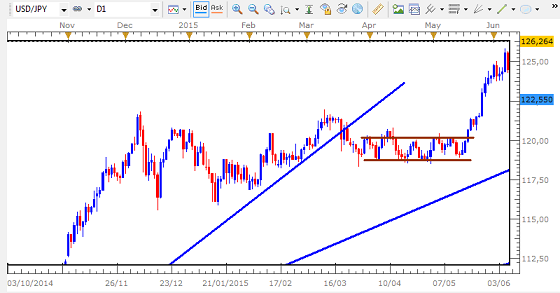
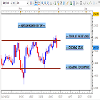
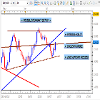
This was trade within Range Setup, with a Bearish Signal given at Resistance indicating a move back to Support
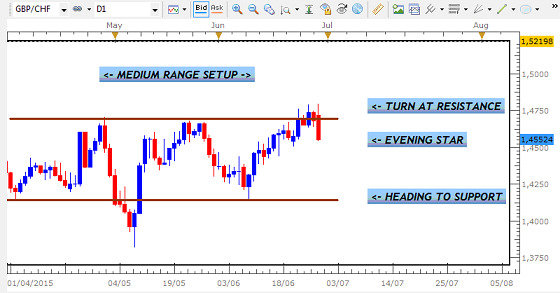
Unfortunately the market pulled back bullish, taking out the trade...
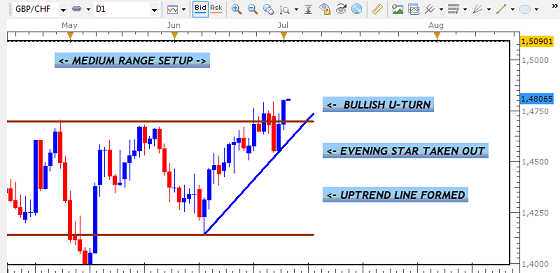
This may have simply been due to the market getting ready to breakout Bullish from the Range.
付属品:
Trade Less, Earn More
Nov 19, 2014からメンバー
157 投稿
Aug 08, 2015 at 19:00
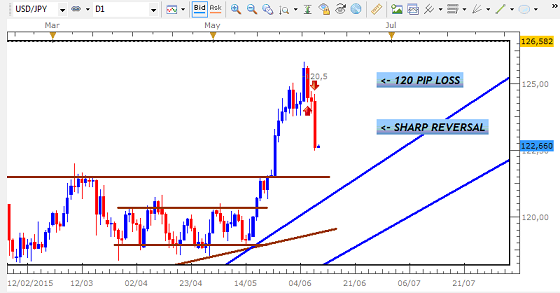
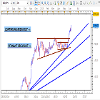
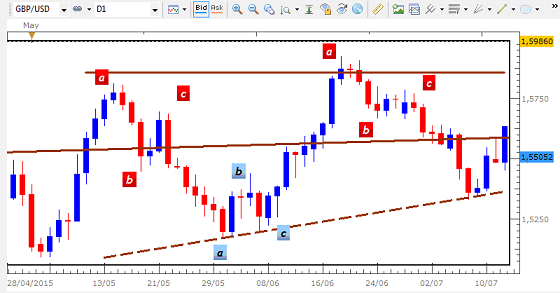
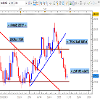
In this trade, I was expecting the pair to rally to the Resistance of the Pennant Setup that appeared to be forming on the Daily Chart.
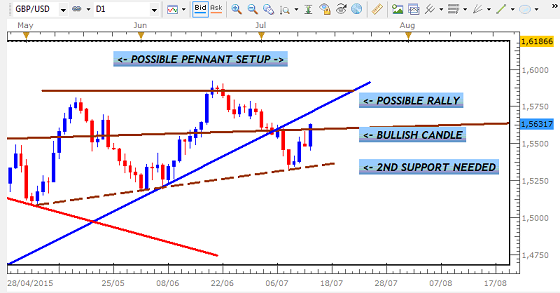
Entry took place at that 2nd Bullish Candle which appeared to be strong enough to continue the rally. However, after the end of the Holding Period, the pair had not hit the target and was starting to pullback. It therefore had to be closed for the small loss of 51 Pips.
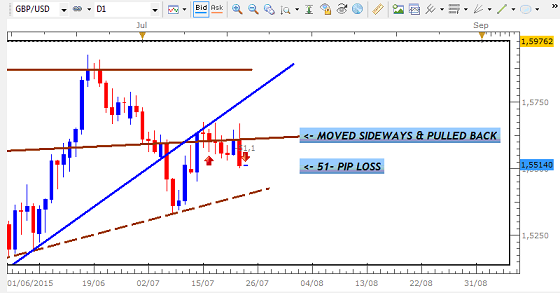
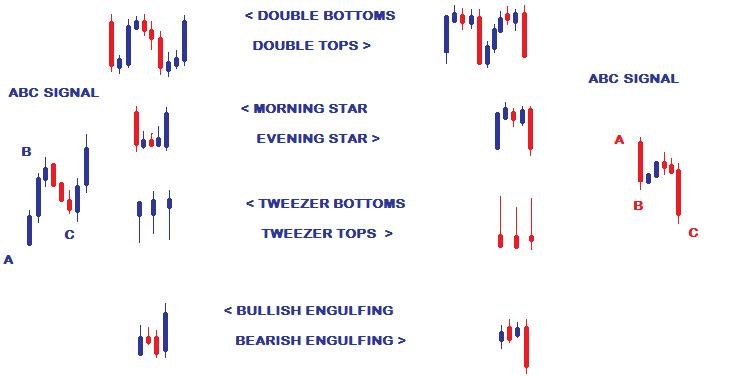
Perhaps the Bull Candle was not strong enough to justify entry. Given that the 3 previous signals were ABC Setups, this Bull Candle Signal was not in sync and should have been avoided.
付属品:
Trade Less, Earn More


*商用利用やスパムは容認されていないので、アカウントが停止される可能性があります。
ヒント:画像/YouTubeのURLを投稿すると自動的に埋め込まれます!
ヒント:この討論に参加しているユーザー名をオートコンプリートするには、@記号を入力します。


