Advertisement
Forecasts And Trade Ideas FX Currencies and Commodities

Mitglied seit Feb 08, 2018
40 Posts
Apr 06, 2018 at 12:03
Would like to share forecast and trading ideas.
Mitglied seit Feb 08, 2018
40 Posts
Apr 06, 2018 at 12:03
Asia Overview by Reuters:
The dollar index was down 0.1 percent at 90.359. The index has risen 0.4 percent this week.
Treasury debt prices gained and yields declined as investors sought the safety of government bonds.The 10-year Treasury note yield fell 2 basis points to 2.811 percent, pulling back from Thursday’s nine-day high of 2.838 percent.
Trump said late on Thursday that he had instructed U.S. trade officials to consider $100 billion in additional tariffs on China, fuelling the trade dispute between the world’s two economic superpower
Traders are focused on NFP. Considering USD’s recent strength, investors are positioning for a stronger labour-market number but there’s also plenty of room (in wage growth and the jobless rate) for a downside surprise, which makes trading NFP this month particularly difficult.
Technical Analysis and Key Levels:
We want to keep it simple for you. As shown in the H4 Chart:
EURUSD is below EMA 50, 100 and EMA 200. Golden Cross is very close. RSI is oversold. However, in the daily chart, RSI has room downside.
The main resistance zone – orange coloured- is 1.23000 – 1.23300. Above the resistance zone, 1.23600 will be the key level for the continuation of the upside move.
Below the current level, 1.22080 – 1.21780 ( Red Coloured ) zone is the main support. Break below this support will carry the price 1.21090 – 1.20900.
1.20900 was the breakout of the bullish triangle. 450 pips bullish move had started after the breakout of 120900. This level is likely to play a key support role. If EURUSD breaks below 1.20900, we can start to speak about a trend reversal and 1.17000.
Anhänge:
Mitglied seit Feb 08, 2018
40 Posts
Apr 08, 2018 at 12:31
GBPUSD Forecast and Technical Analysis Week 09-13 April
Before the forecast and technical analysis, I would like to take a look at our latest trade ideas.
We have a long trade based on Bullish Butterfly and we have reached the first target @ 1.40800.
And Long Trade based on Bullish CwH to add long for ISHS pattern.
Now, let us take a look at the fundamentals:
NFP report was highly disappointing. However, I do not think that would make a too much negative effect on US Dollar. Subsequently, the US unemployment rate also dwelled at the unchanged level of 4.1% instead of falling lower to 4.0% as expected by the market.
The weak UK PMIs did not help Cable to fall below 1.39600. Market players are expecting further rate hikes from BoE as we mentioned in our previous forecast.
The main topic haunting the financial markets was the ongoing trade wars between the US and China.
Technically:
The main trend is still bullish.
On the Daily Chart, the price is above EMA 50,100 and 200.
1.39600 is EMA 50 support of the Daily Chart. That’s why we pay attention to this level. The midterm bullish trend will continue as long as the price holds above 1.39600.
1.42500 as EMA 100 of the weekly chart, acts as a resistance. We can see the price is “locked ” between 1.39600 – 1.42500 – almost 300 pips –
On the H4 Chart: – To see the intraday levels –
1.41000 is the key level for the continuation of the bullish move. If the price breaks above 1.41000, Cable is likely to test 1.41280 and 1.41600.
Below the current level; 1.40800 and 1.40600 are the first levels to test. 1.40380 is the key support. Break below 1.40380 will carry the price 1.40000 and 1.39600 again.
DISCLAIMER: This is a technical analysis study, not an advice or recommendation to invest money
Anhänge:
Mitglied seit Feb 08, 2018
40 Posts
Apr 09, 2018 at 06:03
EURAUD Falling Wedge and Long Opportunity
Chart timeframe: H4
Description: EURAUD completed Falling Wedge pattern. Possible to retest the wedge – 1.59600- and move up. Retracement towards 1.59500 can be used as buying opportunity.
TRADE: LONG
AREA OF THE ENTRY: 1.59800 – 1.59500 Wait for the pullback as described in the chart.
TARGET 1: 1.60700
TARGET 2: 1.61500
INVALIDATION/STOP LOSS LEVEL: 1.58500
Anhänge:
Mitglied seit Feb 08, 2018
40 Posts
Jun 08, 2018 at 08:41
EURUSD Forecast And Technical Analysis 06-08-2018
On the Euro side, Italy is still a risk for investors. The market’s attention is focused on next week’s ECB meeting. Fundamentally there was nothing to boost to push EURUSD higher.
On the Dollar side, USD has lost its charm as Trump protectionism announcements are triggering countermeasures from multiple fronts that will end up weighing on economic progress in the world’s largest economy. And the economic figures are not promising, and doubts occurred about the further rate hikes.
There is no strong data flow today. German Industrial Production and Trade Balance will be released.
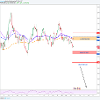
The pair has tested 1.18400 which is the Fibonacci 38.20% major resistance. As seen on the H4 chart timeframe 1.18400 is the extremely overshoot level of MM Lines and EMA 200 resistance
1.17800 is the first level that the pair will test. Break below 1.17800 may carry the price 1.17620 and 1.17500.
1.17200 is the major support of the latest bullish movement. Midterm Bearish pressure will continue as long as the price holds below 1.18400.
Visit our website for more
DISCLAIMER: This is a technical analysis study, not an advice or recommendation to invest money
On the Euro side, Italy is still a risk for investors. The market’s attention is focused on next week’s ECB meeting. Fundamentally there was nothing to boost to push EURUSD higher.
On the Dollar side, USD has lost its charm as Trump protectionism announcements are triggering countermeasures from multiple fronts that will end up weighing on economic progress in the world’s largest economy. And the economic figures are not promising, and doubts occurred about the further rate hikes.
There is no strong data flow today. German Industrial Production and Trade Balance will be released.
The pair has tested 1.18400 which is the Fibonacci 38.20% major resistance. As seen on the H4 chart timeframe 1.18400 is the extremely overshoot level of MM Lines and EMA 200 resistance
1.17800 is the first level that the pair will test. Break below 1.17800 may carry the price 1.17620 and 1.17500.
1.17200 is the major support of the latest bullish movement. Midterm Bearish pressure will continue as long as the price holds below 1.18400.
Visit our website for more
DISCLAIMER: This is a technical analysis study, not an advice or recommendation to invest money
Anhänge:
Mitglied seit Feb 08, 2018
40 Posts
Jun 12, 2018 at 06:10
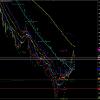
GBPJPY Technical Analysis And Trade Idea
GBPJPY ended the day above EMA 50 and EMA 100 of H4 Chart Time Frame. Dragon reversed from the trendline support. The midterm trend is bullish.
Fibonacci 61.8 and MM 6/8 is located at 147.600. Break below 147.600 will carry the price 148.400 of MM 6/8 Major resistance.
The second resistance is at 147.750 – EMA 200-
We have two closed trades which generated 240 pips. Our Trade idea is :
TRADE: LONG
ENTRY: 147.230
STOP: 146.500
TAKE PROFIT 1: 148.400
TAKE PROFIT 2: 149.150
Alternative Trade idea for conservative traders:
TRADE: LONG
ENTRY: 149.750 – Close above –
STOP: 147.000
TAKE PROFIT 1: 148.400
TAKE PROFIT 2: 149.150
DISCLAIMER: This is a technical analysis study, not an advice or recommendation to invest money
Anhänge:
Mitglied seit Feb 08, 2018
40 Posts
Jun 18, 2018 at 05:50
The rumours that Saudi Arabia and Russia might decide to increase production caused oil prices to fall to close to 3 % on Friday. Meanwhile; U.S. exports were threatened by potential Chinese tariffs on crude oil and refined products.
Saudi Arabia and Russia have already boosted production modestly, and have indicated they were prepared to increase output at that meeting.
Some investors were surprised when crude oil and other energy products were included for tariffs at a later date, the official Xinhua news agency reported, citing the Tariff Commission of the State Council.
Over the past six months, the United States has exported an average 363,000 bpd of crude oil to China, which along with Canada is the biggest buyer of U.S. crude.
Technically:
The short term trend is bearish.
A bearish flag formation completed in the H4 chart. The target of the formation is 62.80.
Crude ended the week 64.24 which meets Fibonacci 78.60 %. At the same level, we see the MM 0/8 Main Support.
From the indicator’s point of view, The price is below EMA 50 and EMA 100 in the daily chart. 62.50 is the main support of the prices.
Key Levels: On the upside 64.45 and 64.80 are the resistance levels. We plan to use possible pullbacks towards those levels as selling opportunities. 62.50 is the main support of the midterm bullish trend. A daily closing below 64.00 USD will carry the prices to 62.50.
Our Bias: BEARISH with the target 62.50
Visit Our Website for more :
Anhänge:
Mitglied seit Feb 08, 2018
40 Posts
Jun 20, 2018 at 06:26
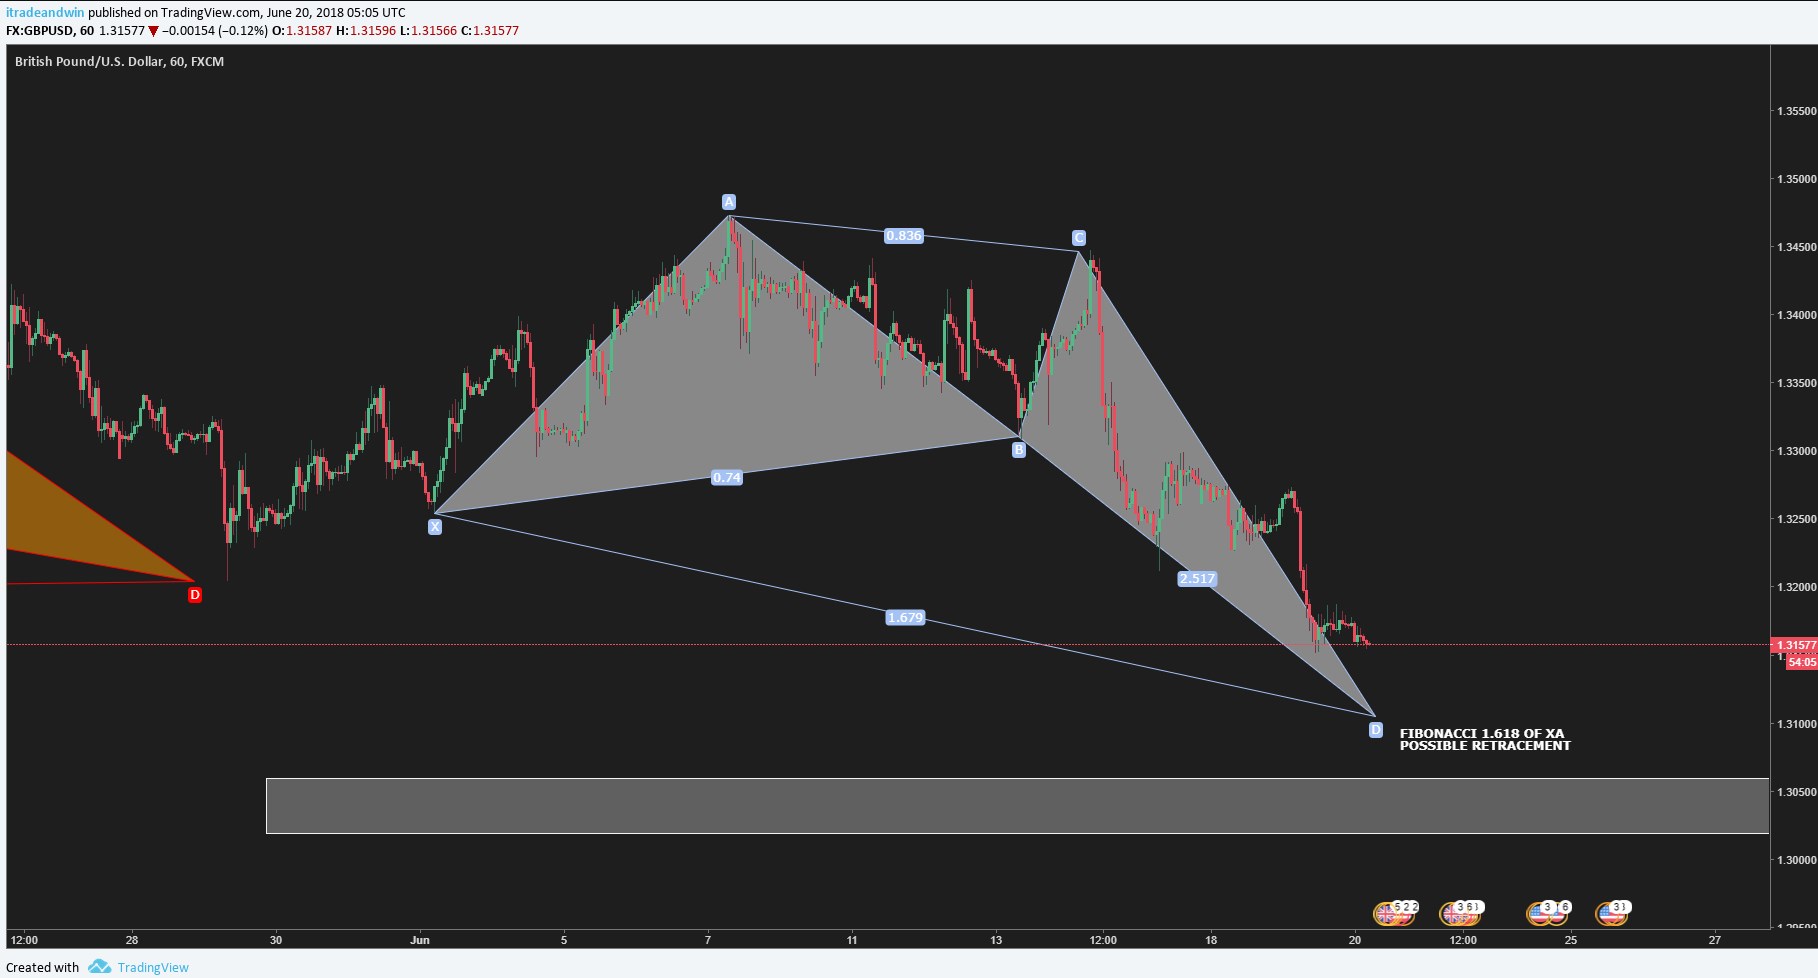
GBPUSD Technical Analysis and Bullish Bat Pattern
Fundamentals:
On the Sterling side, we will have a quite London session with no major macroeconomic data release.
Brexit negotiations continue to grind to a stuttering halt, with key drafts from the June EU summit showing little to no resolutions to the current Irish border issue, and the EU’s Bernier is warning people that they need to be prepared for all possible outcomes, including a “hard Brexit” scenario, one where the UK goes ahead with separating from the EU without any kind of trade agreement in place.
Traders’ focus will remain locked on the upcoming Bank of England (BoE) rate decision, due on Thursday at 11:00 GMT, where the BoE is expected to hold off once again on a rate increase.
On the USD side, we will have Home Sales figures which seems to be a fewer effect on the pair. Brexit and Trade Wars are likely to remain as the determining factors .
Technically:
Cable is trading 1.31600 as of writing.
From the indicators point of view; 1.30600 appears to be the main support for the pair as the MA 100 in the weekly chart. The near-term trendline support is located at the same levels.
On the H4 chart; 1.31540 and 1.31200 are the key support levels. If the pair closes the day below those support levels, the next target will be 1.30600 – 1.30400 zone.
On the H1 chart, we see a Bullish Bat harmonic pattern. Today we will start to buy GBPUSD for midterm purposes. Our stop loss is 1.29000 and targets 1.33000 and 1.34200.
Intraday Trade Idea is to follow the bullish bat formation. Long entry zone 1.31600 – 1.31200 , stop loss 1.30400 targets 1.32800 and 1.33500.
Anhänge:

Mitglied seit Oct 11, 2013
769 Posts
Aug 23, 2018 at 07:15
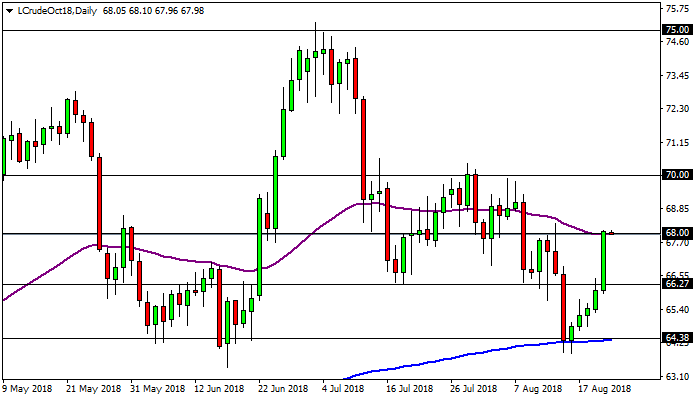
Oil in an interesting resistance
WTI oil has rallied from the 200 day EMA (blue line) at the 64.38 level to the 55 day EMA (purple line) at the 68.00 level. Usually, when the price of an instrument makes this type of movement it stays bouncing up and down between the two moving averages. Therefore, the price may bounce to the downside from the 68.00 level due to the confluence of the moving average and the round number level. In case of a bearish bounce, the 66.27 may act as support, but a better support is at the 200 day EMA. On the other hand, if the price breaks to the upside, above the 68.00 level, its next resistance could be the 70.00 level. Above the 70.00 level, WTI oil could have the road clear to visit the peak at the 75.00 level.
WTI oil has rallied from the 200 day EMA (blue line) at the 64.38 level to the 55 day EMA (purple line) at the 68.00 level. Usually, when the price of an instrument makes this type of movement it stays bouncing up and down between the two moving averages. Therefore, the price may bounce to the downside from the 68.00 level due to the confluence of the moving average and the round number level. In case of a bearish bounce, the 66.27 may act as support, but a better support is at the 200 day EMA. On the other hand, if the price breaks to the upside, above the 68.00 level, its next resistance could be the 70.00 level. Above the 70.00 level, WTI oil could have the road clear to visit the peak at the 75.00 level.
Anhänge:
Mitglied seit Oct 11, 2013
769 Posts
Sep 11, 2018 at 03:50
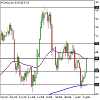
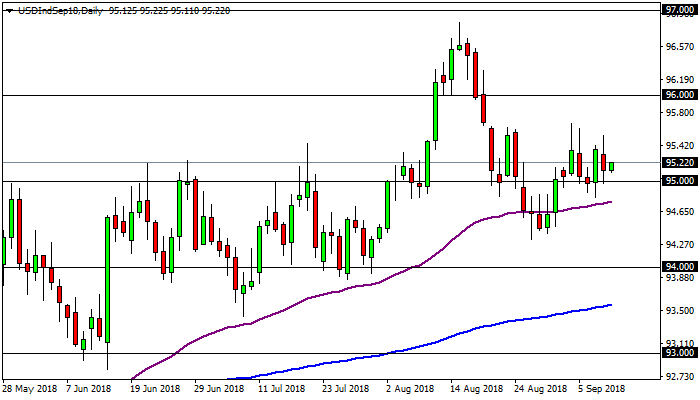
The Dollar index is still consolidating around the 95.00 level without a clear direction. To the upside, the 96.00 level could act as resistance, but the index would have to break above the 97.00 level to keep its longer term bullish trend. Below the 95.00 level, its next support could be the 94.00 level, followed by the 200 day EMA around the 93.50 level, but a better support is at the low of the 93.00 round number level.
Anhänge:
Mitglied seit Feb 08, 2018
40 Posts
Nov 11, 2018 at 13:27
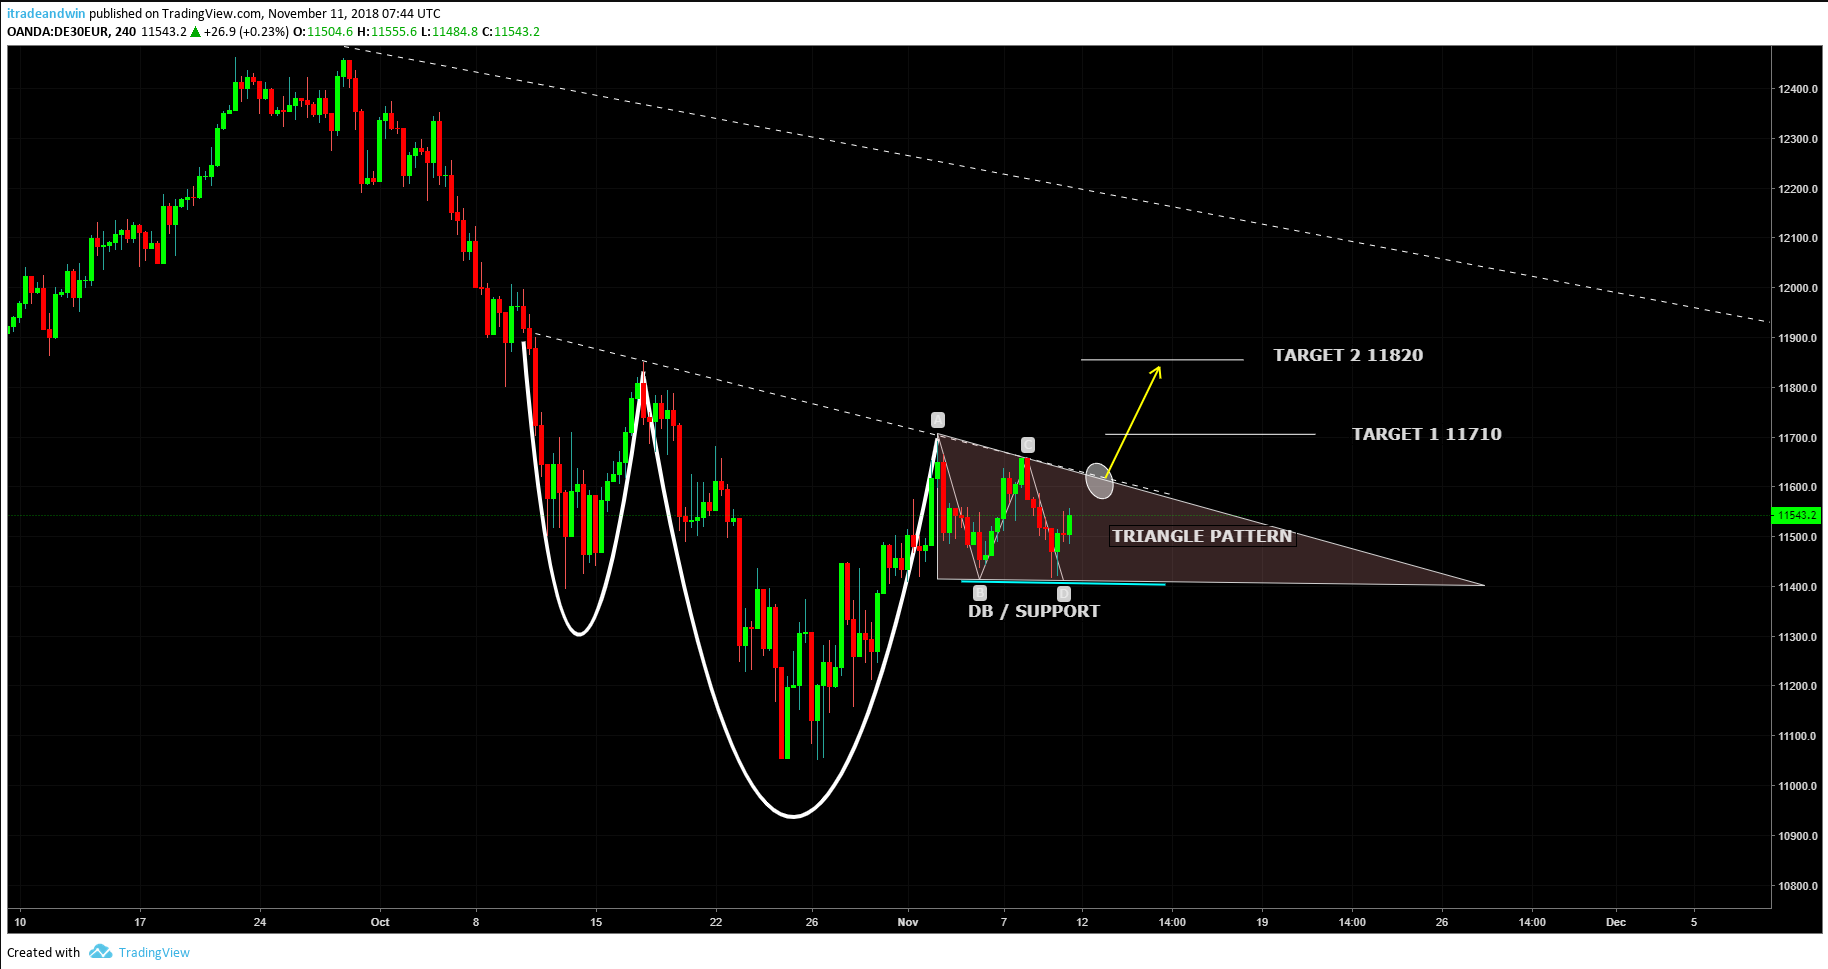
DAX30 Index Descending Triangle Pattern And Long Opportunity
Description: Chartreaderpro finds a potential descending triangle pattern formation. Long opportunity at the breakout of the triangle.
Time Frame: H4
Pattern: Triangle
Facts :
* Finds support and makes a double bottom at 11400
* Price closed above EMA 50
Trade Opportunity: Buy the potential breakout of the triangle as shown in the chart.
Estimated breakout level: 11563 – Confirmed by MM 2/8
Targets: 11710 and 11820
Invalidation Level: Below the double bottom 11400
Aggressive Traders: May long at the current level with the same stop loss
Anhänge:
Mitglied seit Feb 08, 2018
40 Posts
Dec 16, 2018 at 10:01
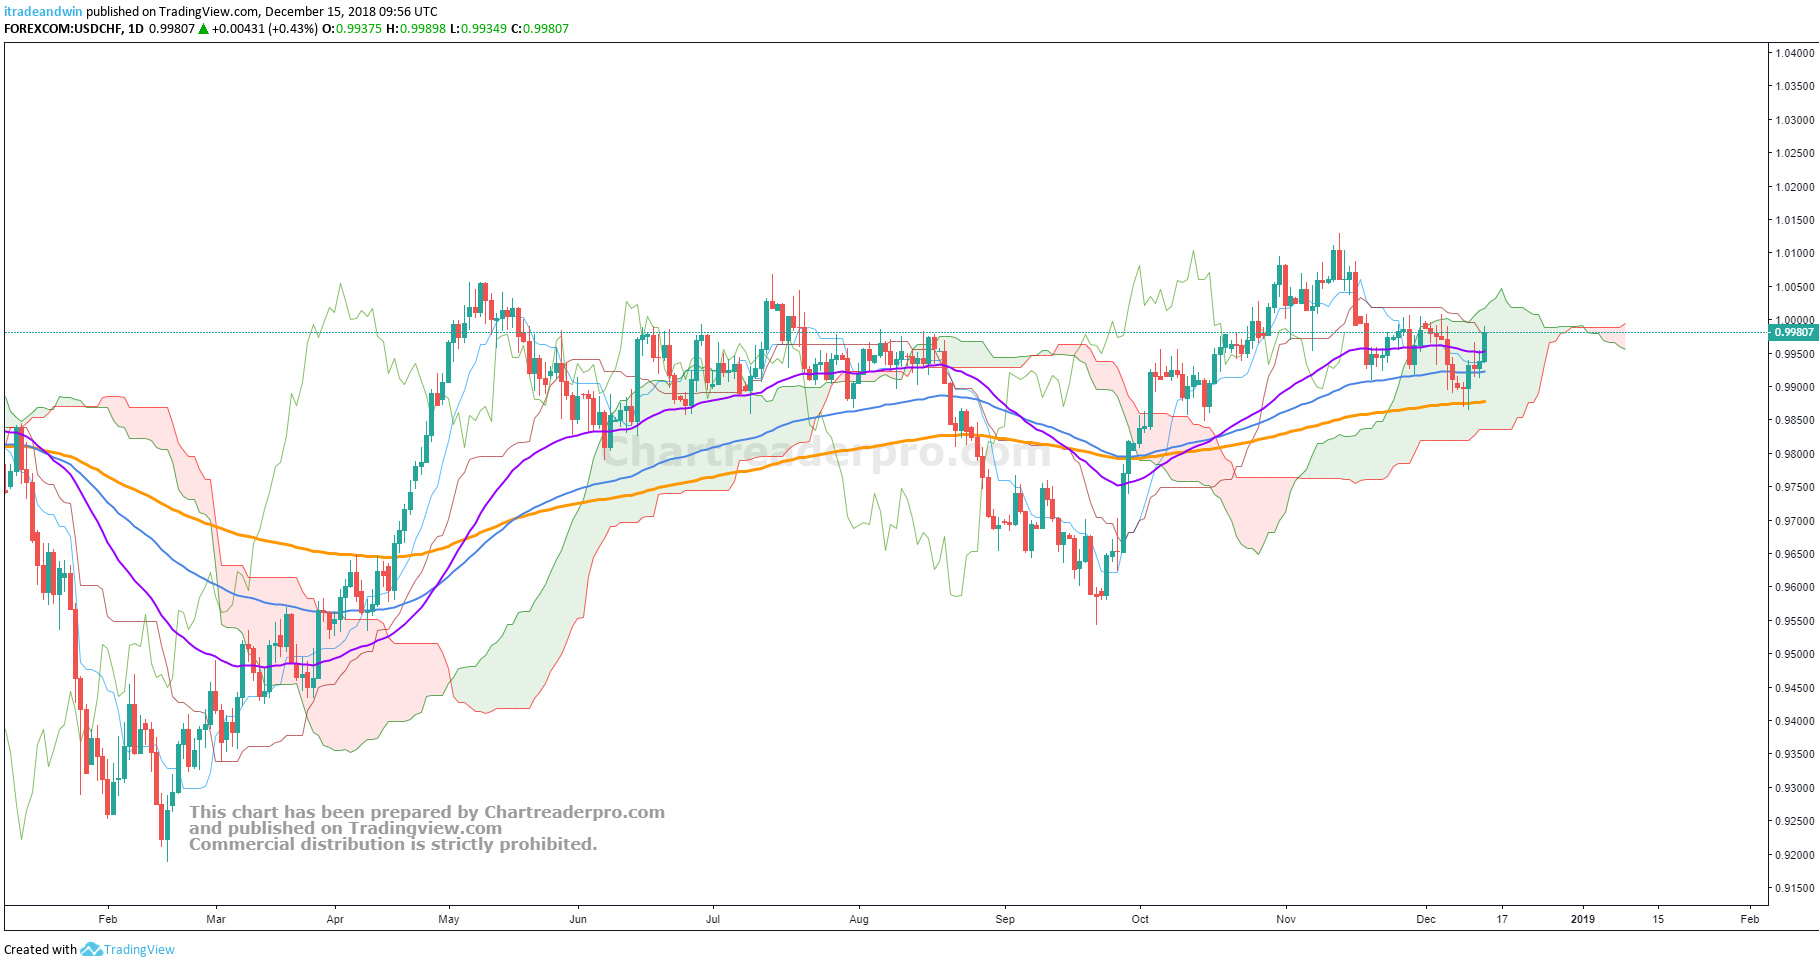
USDCHF Forecast: Capped by the parity level
SNB announced its interest rate decision last week and kept its ultra-accommodative monetary policy unchanged as expected.
The statement came out as expected by the market players. Swiss National Bank maintained its ultra-accommodative monetary policy unchanged, with the interest rate on sight deposits remaining fixed at -0.75%, and the three-month Libor target range at -1.25% to -0.25%.
It also indicates that it will continue to intervene as needed in the foreign exchange market. It still considers that the Swiss franc is “highly valued” even though the currency has depreciated slightly in a value weighted by foreign trade. This is due to the strengthening of the dollar, while the franc hasn’t changed much, remaining at a high level against the euro.
Wednesday; FED’s rate hike decision and FOMC Statement will be announced. It is widely expected a rate hike from FED that should bring the overnight target range to 2.25%–2.50%. The key outcome of the post-rate decision press conference is the economic and the monetary policy outlook Powell is going to pursue. If the Fed chair
Charts. Above the current level, if the pair breaks out the parity, the targets of the Bulls will be 1.00400, 1.0065 and 1.01110.
On the smaller chart timeframes, the pair tested SMA 200 on H4 Chart at 0.99900. A firm closing above the parity level may be the confirmation of the bullish continuation.
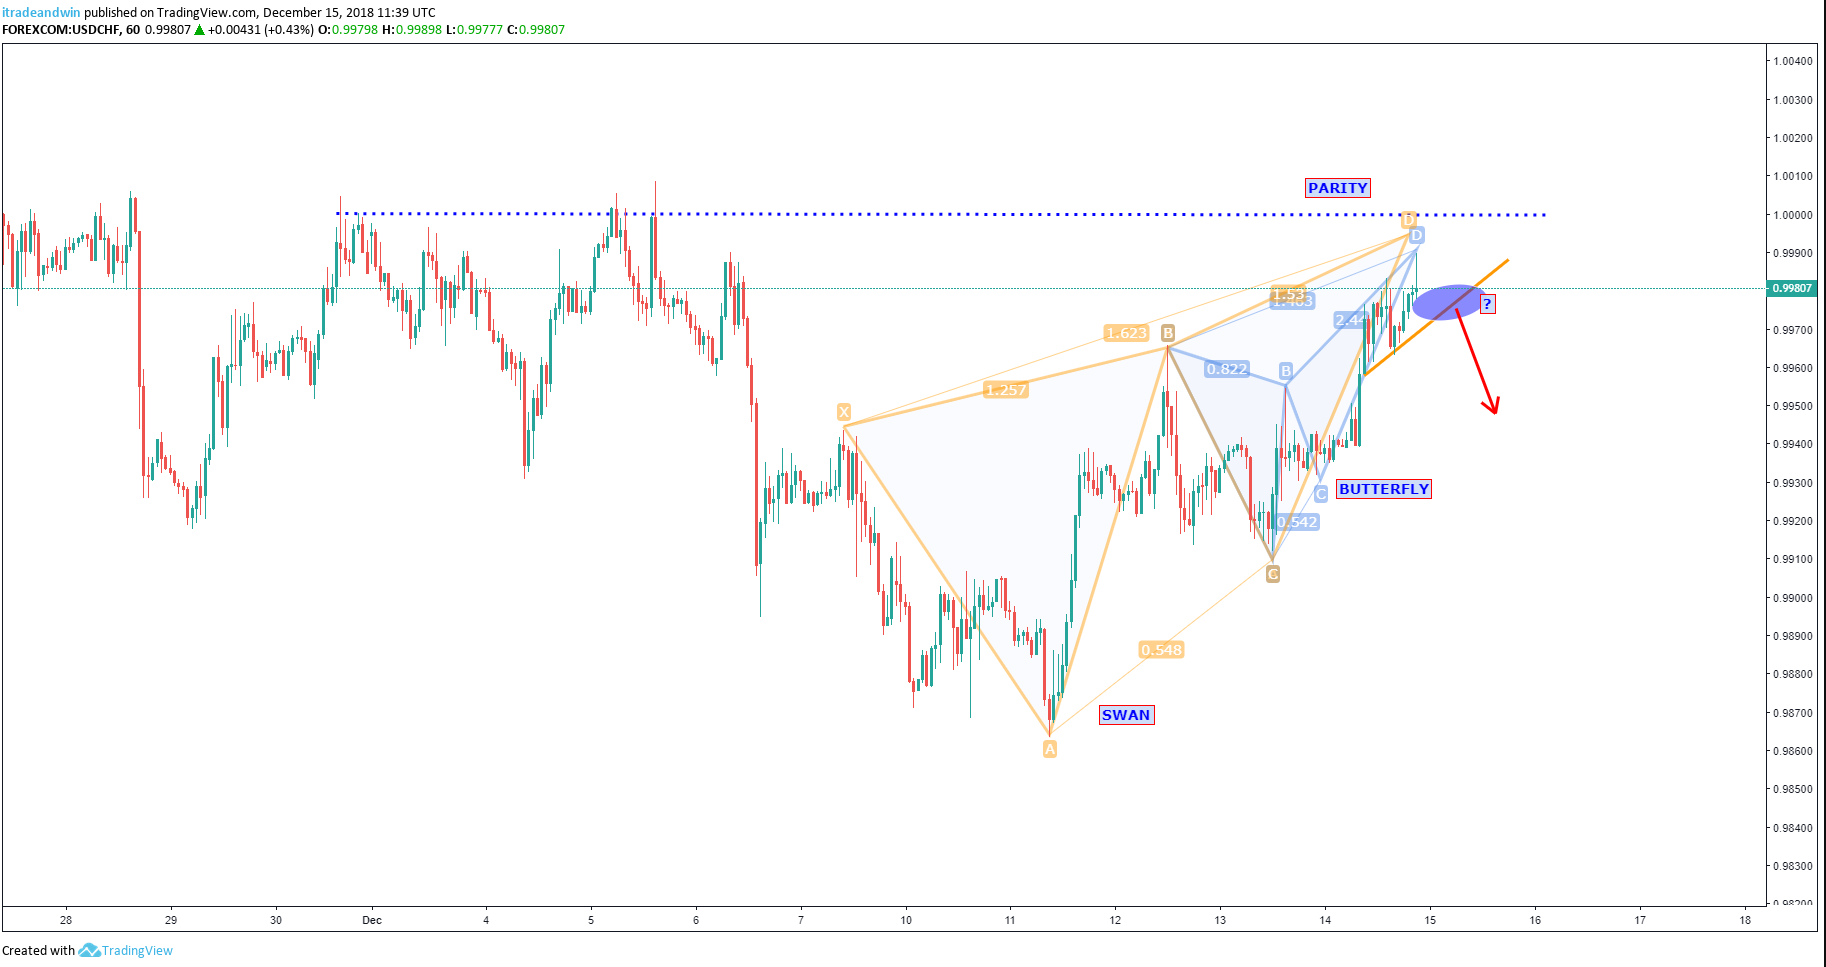
On the H1 chart, a bearish Black Swan and Butterfly formations send a bearish correction signal. A break below 0.99760 can send the pair 0.99500 and 0.99200 levels which are shaped by EMA 50 and MA 20 on H4 Chart.
Anhänge:
Mitglied seit Feb 08, 2018
40 Posts
Jan 20, 2019 at 07:56
itradeandwin posted:
Would like to share forecast and trading ideas.
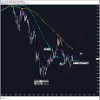
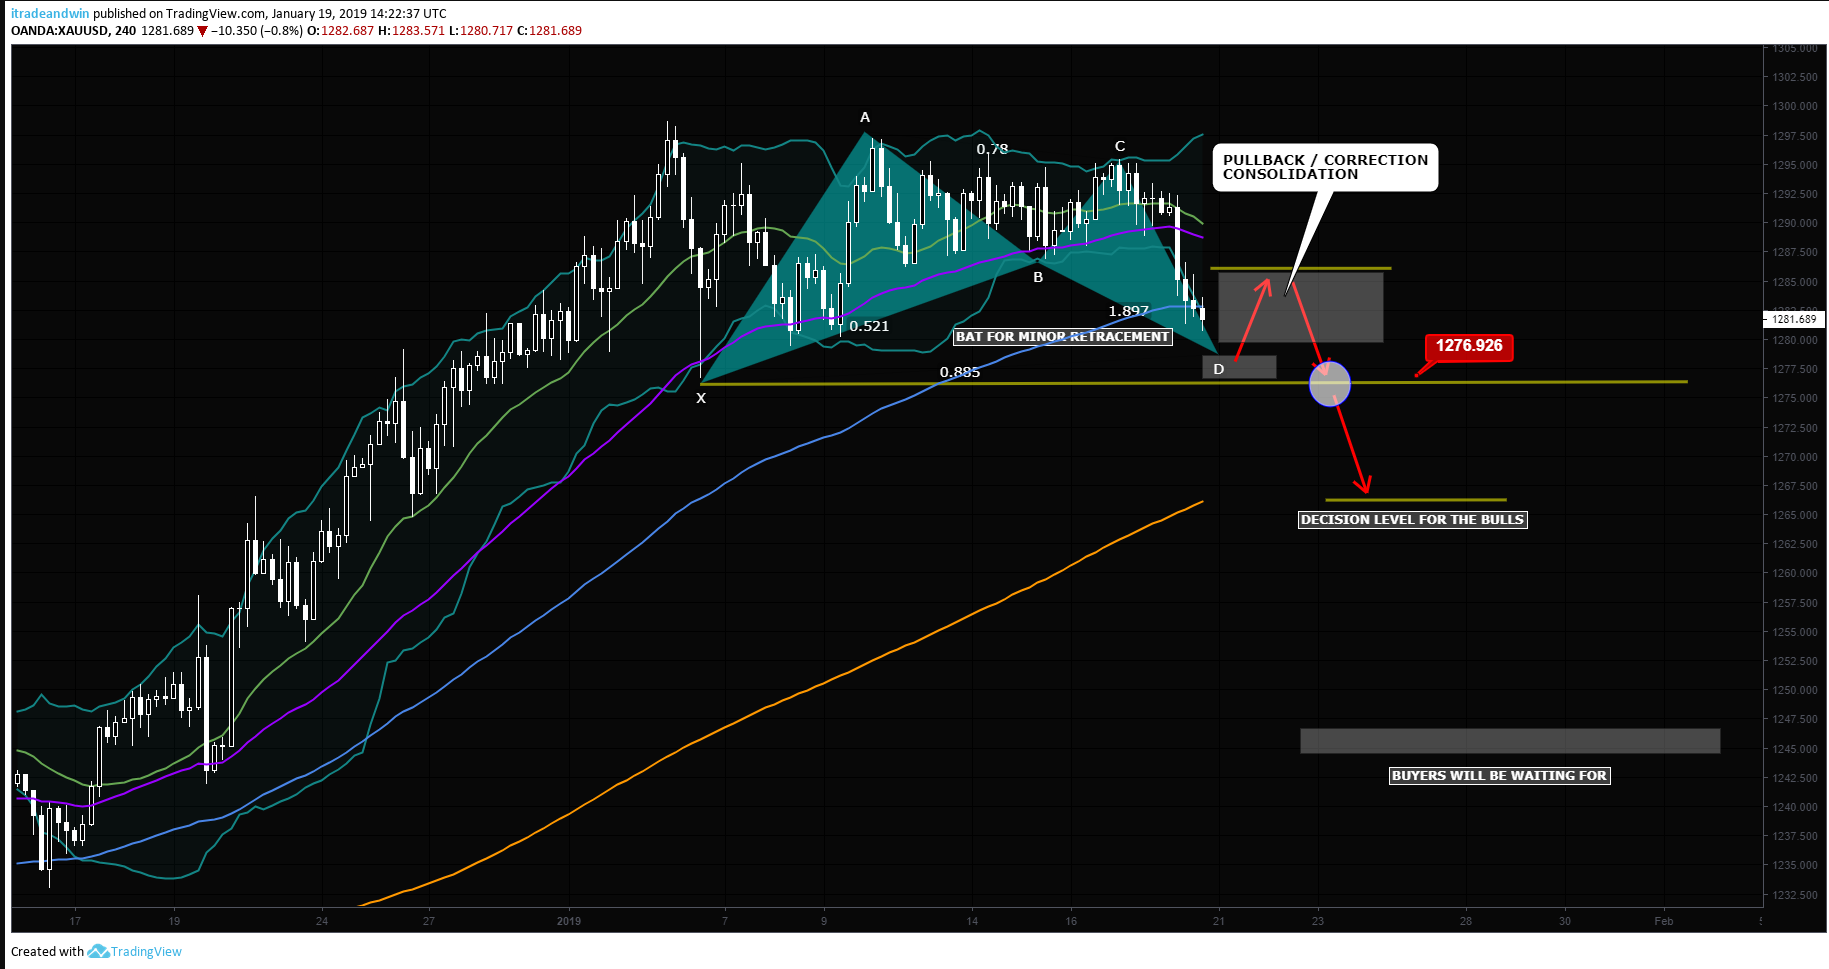
XAUUSD Gold Trade Plan: Correction Consolidation and Bearish Continuation
Near Term Bearish Gold Fundamentals
Improving optimism is picking up as the U.S. and China appear to be moving closer to resolving their trade dispute.
Growing momentum in the U.S. dollar, and rising equity markets. Equity markets soon will be normalised. Because of the government shutdown, the U.S. economic data remains relatively light. Markets are pricing: No News is Good News”
No fresh need for safe-haven assets in the near term.
Gold is doing what it’s supposed to as a hedge: it’s taking a breather as other asset classes rally.
Technically:
Gold is still in the bear market. The trend change is above $ 1.375.
Gold Prices will remain under bearish pressure below 1300. We really need to see signs of lower growth in the US for gold to see a sustained push above 1300.
Markets are closed Monday in recognition of Martin Luther King Jr. Day.
We predict a minor correction somewhere 1278 – 1277 towards 1285 – A Bullish Bat Pattern-
After a consolidation XAUUSD is likely to retest 1276.50 support. The breakout of 1276 would push the prices towards 1265-1261 zone.
The bigger fight may start at $ 1.265. If some really strong buyers do not come in, the Gold prices will meet $ 1.240.
Fresh Entry Levels for Gold Trade: ( Stop Above 1300 )
Sell the Potential Pullback at 1285
Sell the breakout of 1276
Targets: 1265 1250 1238
Anhänge:
Mitglied seit Feb 08, 2018
40 Posts
Jan 20, 2019 at 07:57
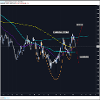
USDCAD Forecast and Key Technical Levels
Fundamentals on USD Side:
Delay on the reports due to shutdown:
The U.S. dollar traded higher against all of the major currencies Friday with the exception of the Canadian dollar because as it turns out, the U.S. government shutdown has been good for the dollar and stocks.
The delay of U.S. government releases gives the market relief. Major reports such as retail sales and the trade balance have been delayed due to the shutdown and while government shutdowns don’t tend to inflict lasting damage on the economy, it’s never gone on for this long.
Dovish comments from the Fed Members continue to hit the wires.
US Markets will be closed on Monday due to Martin Luther King, Jr. Day in the US.
The most important USD data to be released next week:
Tuesday: Home Sales
Thursday: Manufacturing, Services and Markit Composite PMI
Friday: Core Durable Goods Orders and New Home Sales
Fundamentals on CAD Side:
CPI unexpectedly rebounded to 2.0% in December despite a notable drag from energy prices. Expectations were for the headline rate to hold steady at 1.7%, but a significant jump in airfares (methodology changes have made this component extremely volatile over the last six months) added a surprising 0.3 percentage points. By contrast, the BoC’s core inflation measures were marginally softer on balance (averaging 1.87% y/y) following revisions to the November figures. The BoC sees that as evidence the economy has been operating close to full capacity for more than a year now.
BoC is likely to be patient in raising interest rates. Markets think that The BoC will want to see how the economy is progressing through this latest oil price decline, and expect the current pause in their tightening cycle will extend through their next meeting in March
The most important CAD data to be released next week:
Tuesday: Manufacturing Sales and Wholesale Sales
Wednesday: Retail Sales and Core Retail Sales (Nov)
Technical Overview:
Last week we saw the pair in a consolidation process. The downside is limited by 1.31800 and the upside capped by 1.33000.
Loonie is trading below all main EMAs on the H4 chart still in the bearish territory of smaller chart timeframes. A clear break above 1.33000 may carry the price towards 1.33600 which is blocked by the EMA100 and EMA200.
A clear break below 1.32400 may push the price towards 1.31800 – SMA 100 Support-
We need to see a firm closing below 1.31800 for the bearish continuation. 1.30000 will be the targets of the Bears after a potential breakout of 1.31800.
Harmonic Overview:
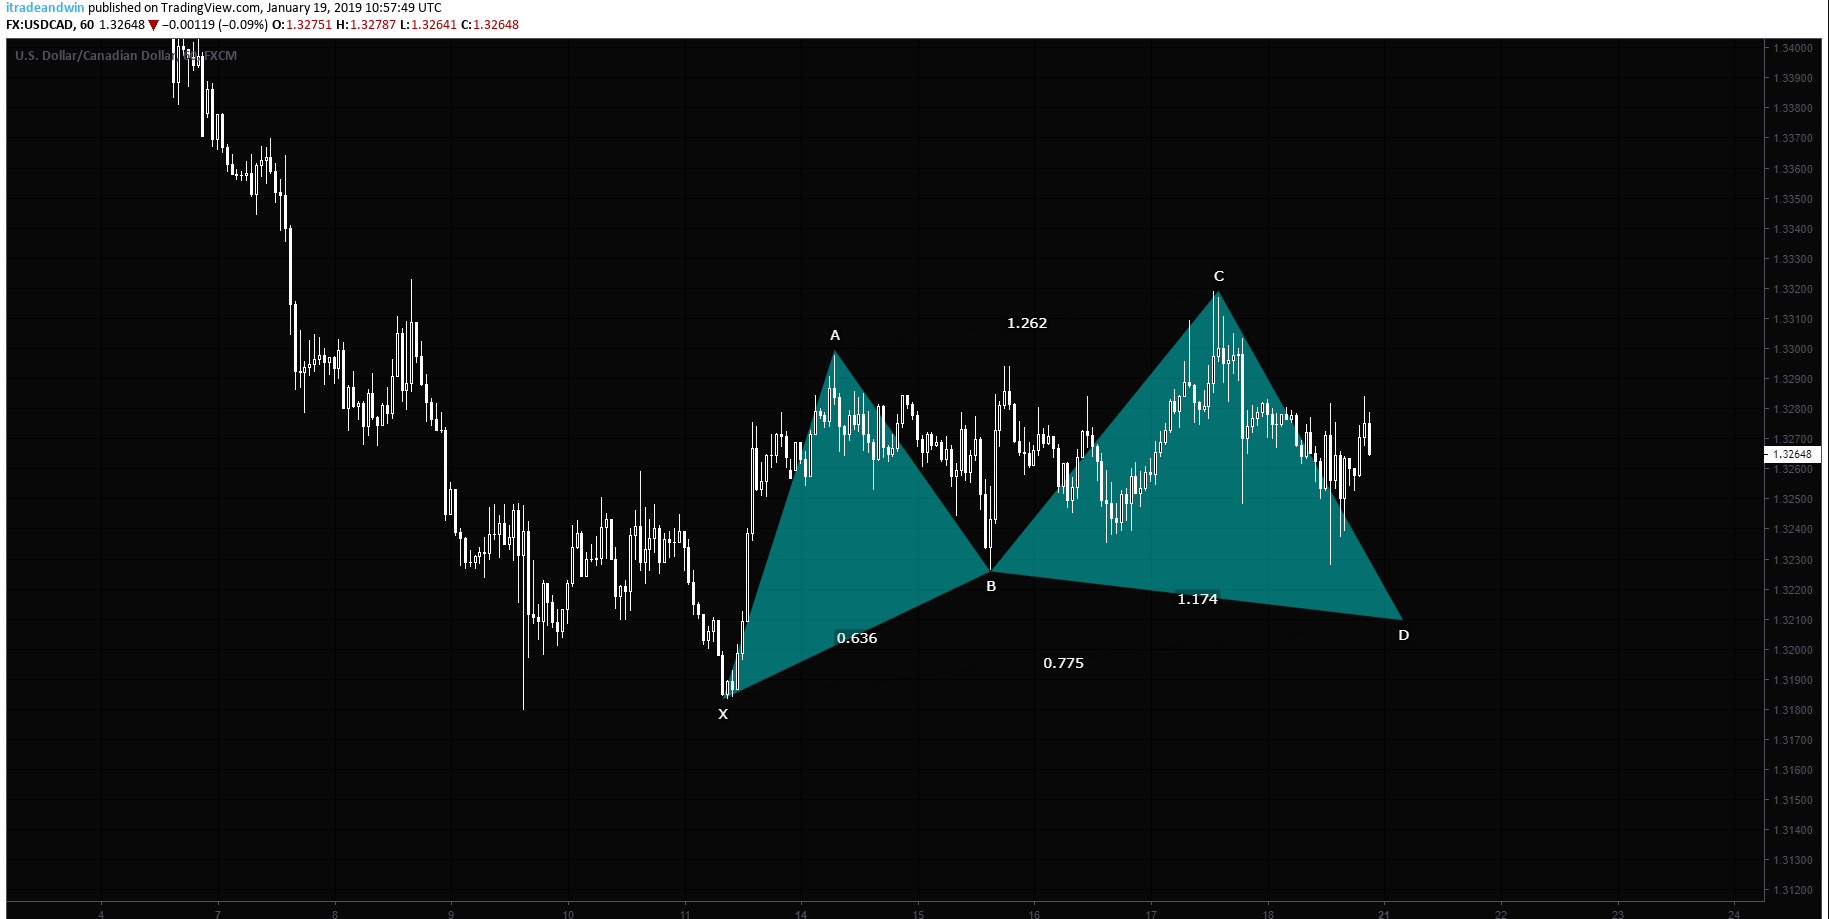
A potential Bullish Cypher Pattern would be completed at 1.32000. This level can be used as a buying opportunity
Fundamentals on USD Side:
Delay on the reports due to shutdown:
The U.S. dollar traded higher against all of the major currencies Friday with the exception of the Canadian dollar because as it turns out, the U.S. government shutdown has been good for the dollar and stocks.
The delay of U.S. government releases gives the market relief. Major reports such as retail sales and the trade balance have been delayed due to the shutdown and while government shutdowns don’t tend to inflict lasting damage on the economy, it’s never gone on for this long.
Dovish comments from the Fed Members continue to hit the wires.
US Markets will be closed on Monday due to Martin Luther King, Jr. Day in the US.
The most important USD data to be released next week:
Tuesday: Home Sales
Thursday: Manufacturing, Services and Markit Composite PMI
Friday: Core Durable Goods Orders and New Home Sales
Fundamentals on CAD Side:
CPI unexpectedly rebounded to 2.0% in December despite a notable drag from energy prices. Expectations were for the headline rate to hold steady at 1.7%, but a significant jump in airfares (methodology changes have made this component extremely volatile over the last six months) added a surprising 0.3 percentage points. By contrast, the BoC’s core inflation measures were marginally softer on balance (averaging 1.87% y/y) following revisions to the November figures. The BoC sees that as evidence the economy has been operating close to full capacity for more than a year now.
BoC is likely to be patient in raising interest rates. Markets think that The BoC will want to see how the economy is progressing through this latest oil price decline, and expect the current pause in their tightening cycle will extend through their next meeting in March
The most important CAD data to be released next week:
Tuesday: Manufacturing Sales and Wholesale Sales
Wednesday: Retail Sales and Core Retail Sales (Nov)
Technical Overview:
Last week we saw the pair in a consolidation process. The downside is limited by 1.31800 and the upside capped by 1.33000.
Loonie is trading below all main EMAs on the H4 chart still in the bearish territory of smaller chart timeframes. A clear break above 1.33000 may carry the price towards 1.33600 which is blocked by the EMA100 and EMA200.
A clear break below 1.32400 may push the price towards 1.31800 – SMA 100 Support-
We need to see a firm closing below 1.31800 for the bearish continuation. 1.30000 will be the targets of the Bears after a potential breakout of 1.31800.
Harmonic Overview:
A potential Bullish Cypher Pattern would be completed at 1.32000. This level can be used as a buying opportunity
Anhänge:
Mitglied seit Feb 08, 2018
40 Posts
Feb 06, 2019 at 09:48
EURJPY Technical Overview and Trade Setup
Our previous EURJPY trade reached its second target and generated 100 pips so far.
Latest Germany Factory Orders data is showing that the industrial slowdown continues in Eurozone. Safe haven assets are getting demand.
EURJPY is trading below EMA 50 on the H4 chart and testing the Ichimoku Cloud support. The pair is likely to test 124.600.
Breakout of the zigzag trendline will trigger the bearish move. Estimated breakout level is 124.400.
Targets of the pair will 123.830, 123.420 and 122.650.
Anhänge:
Mitglied seit Feb 08, 2018
40 Posts
Feb 07, 2019 at 09:14
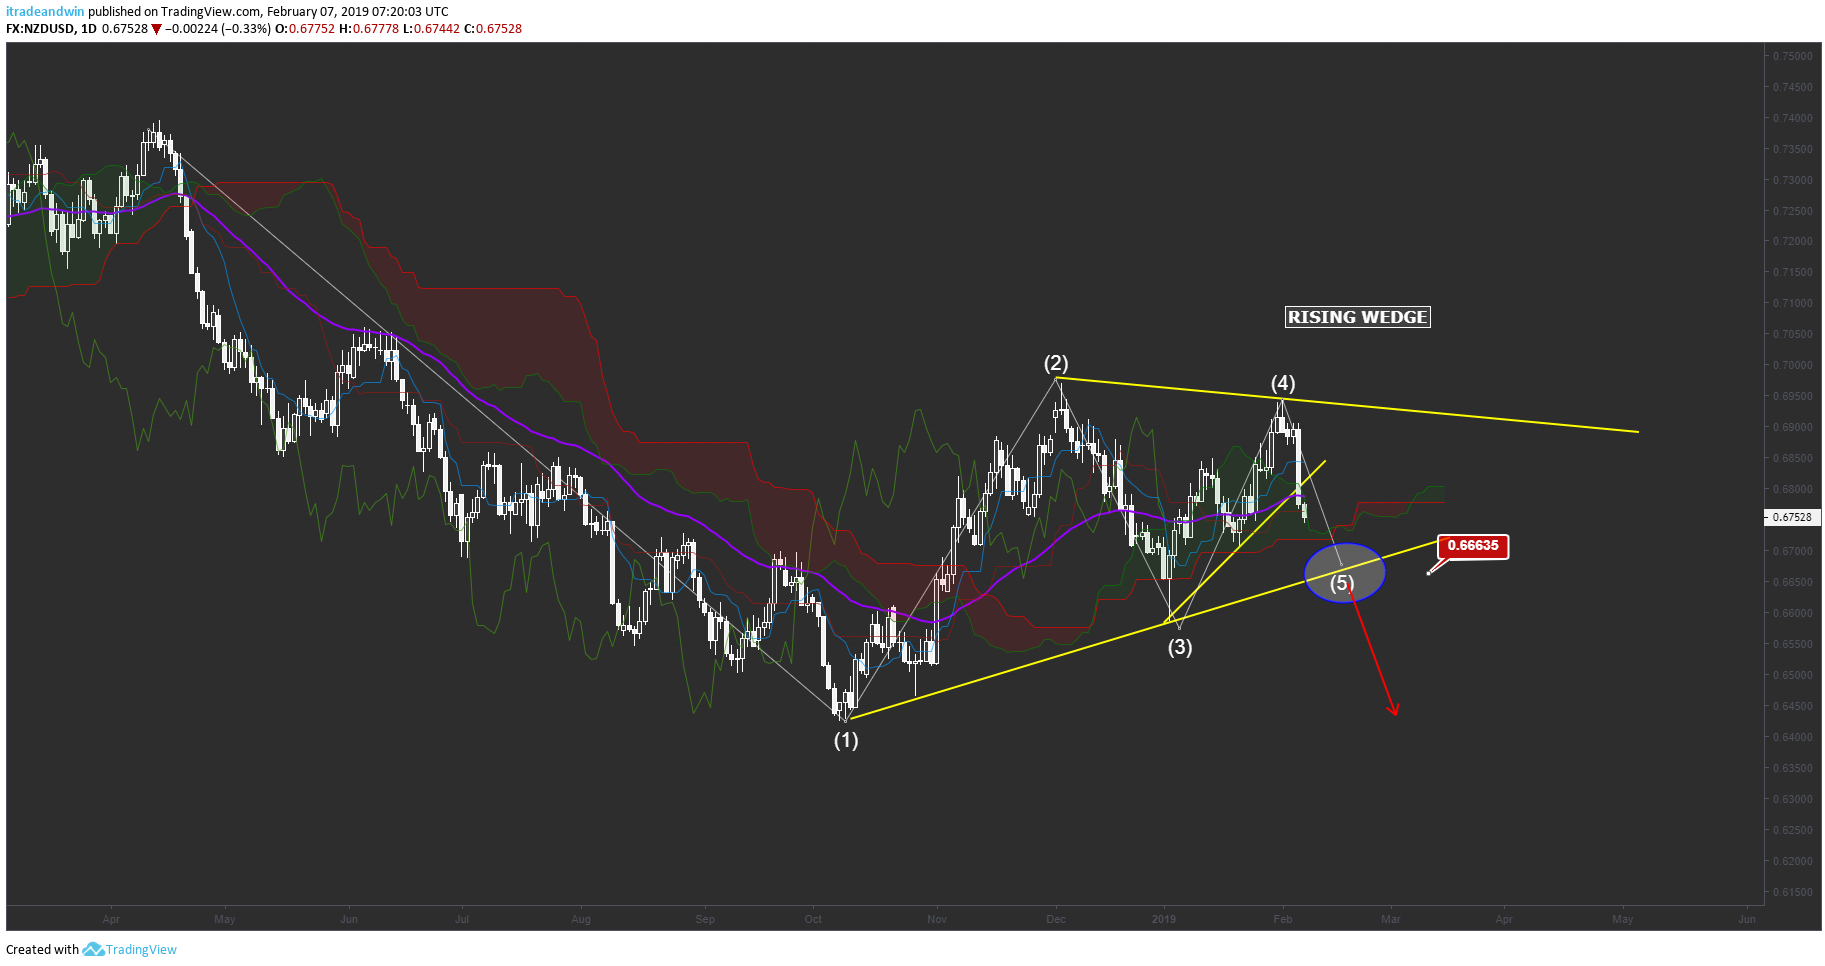
NZDUSD Forecast: Kiwi continues to lose weight
I have published a midterm NZDUSD forecast in January and would like to update.
Latest New Zeland macroeconomic figures are showing the economy is slowing down.
Employment Change (QoQ) (Q4) 0.1%
Labor Cost Index (QoQ) (Q4) 0.5%
Labor Cost Index (YoY) (Q4) 2.0%
Participation Rate (Q4) 70.90%
Unemployment Rate (Q4) 4.3%
BNZ, which is one of the most dovish central banks by stating that it will not increase any interest rates until the end of 2020, can continue to hold its dovish stance in the next week’s meeting with this data.
On the other hand, the FED is still the safest haven with its USD 2.5% interest rate even though its dovish stance.
Economic Calendar
The most important calendar data for the pair is undoubtedly RBNZ meeting on February 13th – No policy change is expected
If the negotiations between the US and China to be held on February 28th do not result in a market expectation, the market may switch to risk-off mode. This may be catalysed for new decreases in the pair.
Technically:
The pair broke the short term bullish trend line. We see a triangle pattern on the daily charts. The pair is likely to test the baseline of the triangle 0.66500. Breakout of the triangle will trigger the bearish move.
Invalidation level of the pattern is 0.69500.
Breakout Level is 0.66500
Targets will be:
0.6590
0.6550
0.6440
0.6340
Anhänge:
Mitglied seit Feb 08, 2018
40 Posts
Feb 10, 2019 at 09:42
EURCHF Forecast and Bullish Cypher Formation
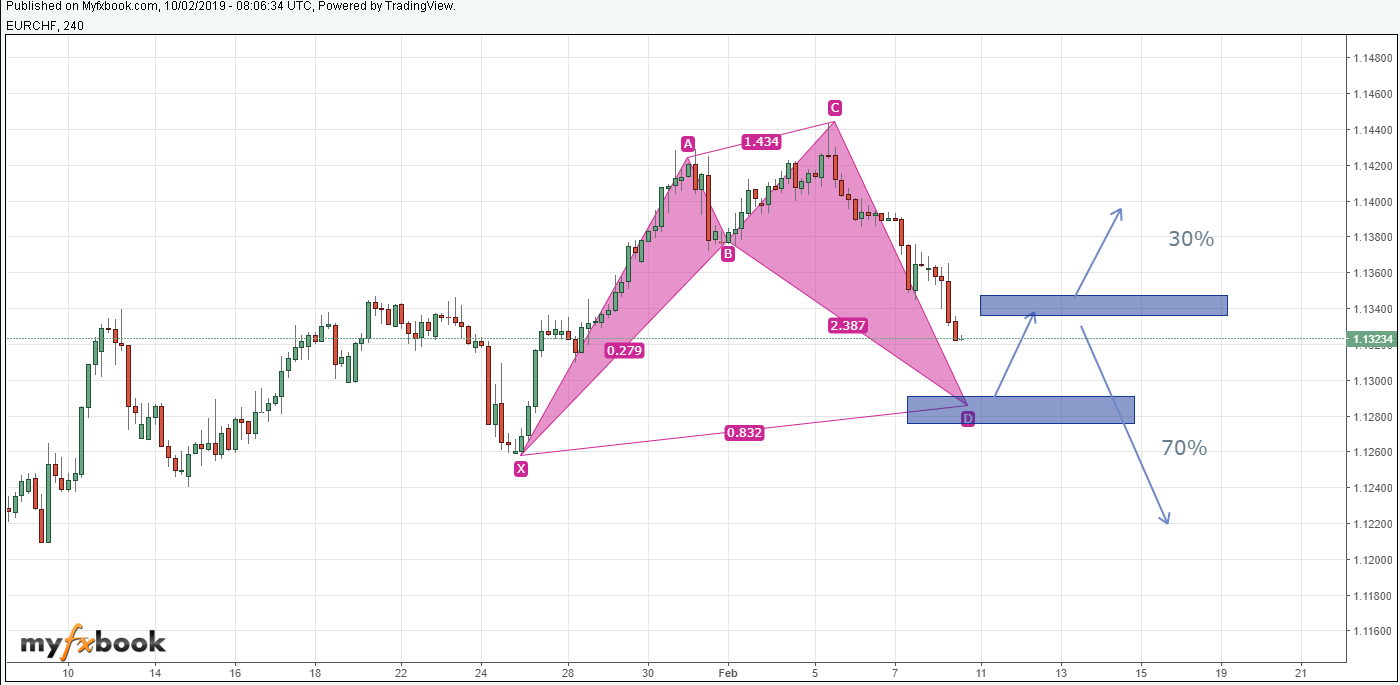
Fundamentals: Euro is losing weight amid disappointing macroeconomic data and political turmoil. Swiss Franc is gaining weight as a safe haven asset.
Technically: As seen on the below Dail chart, the pair broke down 1.13500 support and ended the week at 1.13240. The pair ended the week in the lower Bollinger Band and below EMA 50. Bearish pressure will continue as long as the price stays below 1.13500.
Harmonic Overview and Trade Opportunity:
As seen on the H4 chart, the price is likely to continue to decline and test 1.13000 psychological support. A bullish Cypher pattern would be completed at 1.12980 and a Bullish Shark pattern completed at 1.12760. A technical correction is predicted between 1.12980 – 1.12760
Targets: 1.13000 1.13300 1.13500
Anhänge:
Mitglied seit Feb 08, 2018
40 Posts
Feb 10, 2019 at 15:16
GBPJPY Forecast and Trade Setup Update
The pound is trading under a slightly bearish pressure amid Brexit uncertainty and latest dovish BoE statement.
On the other hand; JPY is getting demand as a safe haven asset. As we have mentioned in our previous JPY forecast, the IMF’s global growth projections suggest that Japan’s healthy growth may cause the Yen to shine in the future.
Dragon ended the week at 142.020, just below EMA 50 and in the lower Bollinger Band after rejecting MA 100 & MA 200. RSI headed south.
On the H4 Chart, technical indicators turn to bearish. The price closed below EMA 50 and MA 100.
However, we can not talk about a trend reversal as long as Dragon holds above 140.600.
On the upside, 142.900 remains as the key resistance. The bearish pressure will continue as long as the price stays below 142.900.
On the downside, 141.400 and 141.100 are the levels to focus on Monday. We keep our short position targeting 140.600. A clear breakout of 140.600 may send the price 139.800, 139.000 and 138.200 Fibo 88.6 Retracement.
Anhänge:
Mitglied seit Feb 08, 2018
40 Posts
Mar 11, 2019 at 07:23
Brexit Scenarios, Sterling Report and GBPUSD Forecast
Parliament is about to enter another decisive week in the Brexit deliberations. On Tuesday MPs will vote on Theresa May’s deal, and, if it falls, on a no-deal Brexit and the question of extending article 50.
BREXIT
Calendar and Scenarios
March 12th: Parliament votes for May – EU revised plan.
Expectation: NO
If Parliament approves the plan;
1. Sharp Rally of GBP pairs.
2. March 21th – March 22nd: EU votes fort he agreements
3. Trade Talks between UK-EU begins.
4. Sterling may slow down because of the uncertainty.
If the UK Parliament rejects the agreement;
March 13th: Parliament votes for No Deal Brexit.
Markets Expectations: NO
If Parliament approves No Deal Brexit;
1. Sell off in Sterling
2. Boe projection: 25% decline in Sterling. %8 decline in incomes.
3. BoE may go to a rate hike operation to protect the Sterling.
4. Increase in the Global Uncertainty.
If UK Parliament says NO to No Deal Brexit
March 14th: Vote on delayed Brexit
The market is pricing this scenario. The bullish trend in Sterling started with the expectations of delayed Brexit.
If Delayed Brexit Scenario becomes validated, we may see a rather small Sterling rally after the parliament’s “YES” to a delayed Brexit.
However, a delayed Brexit will not be the end of the uncertainties. That is the reason for the latest retracement in Sterling.
At the point, the most positive scenario on the table is the second Brexit referendum.
The Labour leadership, having seen its alternative soft Brexit proposals defeated, has formally announced support for a second referendum, suggesting this to be the logical consequence of the formal party conference position established last autumn.
If this scenario –the second referendum- gains weight we will see a sustainable Sterling Rally. We must say that the Sterling is very cheap now in the mean of real effective currency strength.
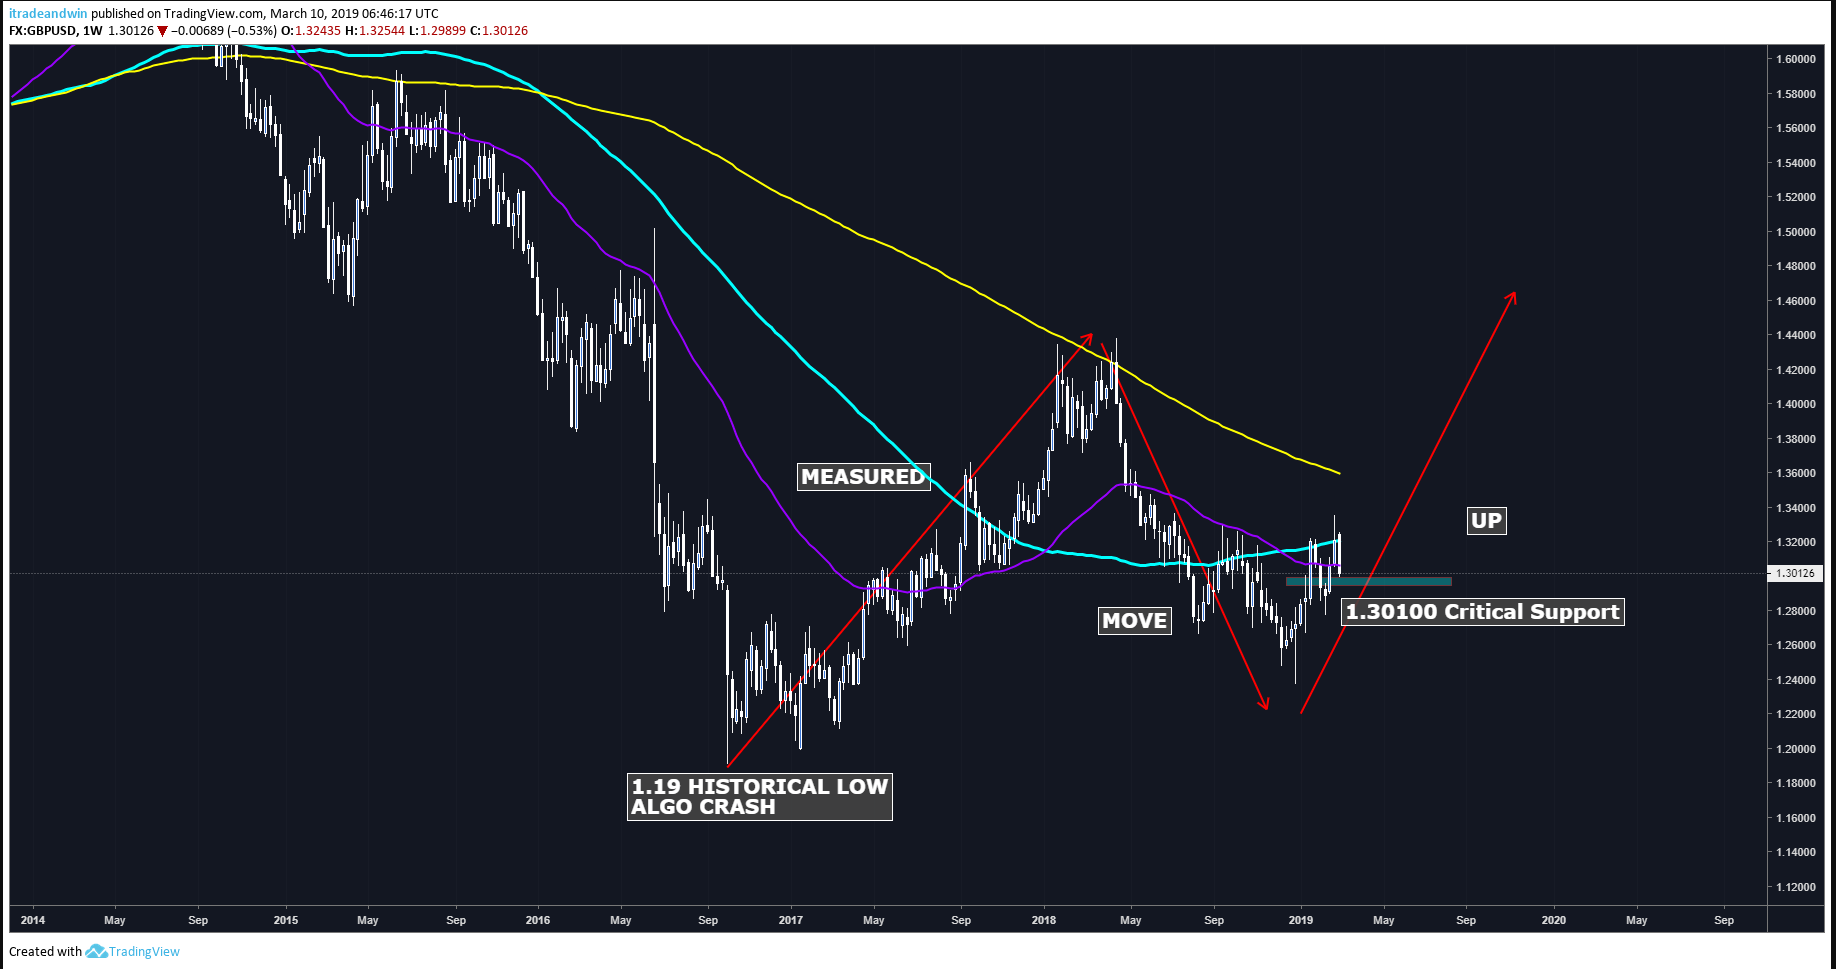
As seen on the weekly chart, we see a measured move up printing. After making historical low 1.19000 by an Algo Crash – in 24 hours-, Cable tested 1.45000 key resistance. The fresh bearish movement was triggered by Brexit and FED’s rate hike cycle. Dips completed at 1.25000 and Cable entered into the recovery period. The target of the formation is 1.48000 but a few fundamentals are needed and it is not the subject of this forecast. 1.30100 is the key support. If GBPUSD makes daily closings above 1.30100, we could see the pair moving towards 1.34500 – 1.38000 with an accelerated bullish trend.
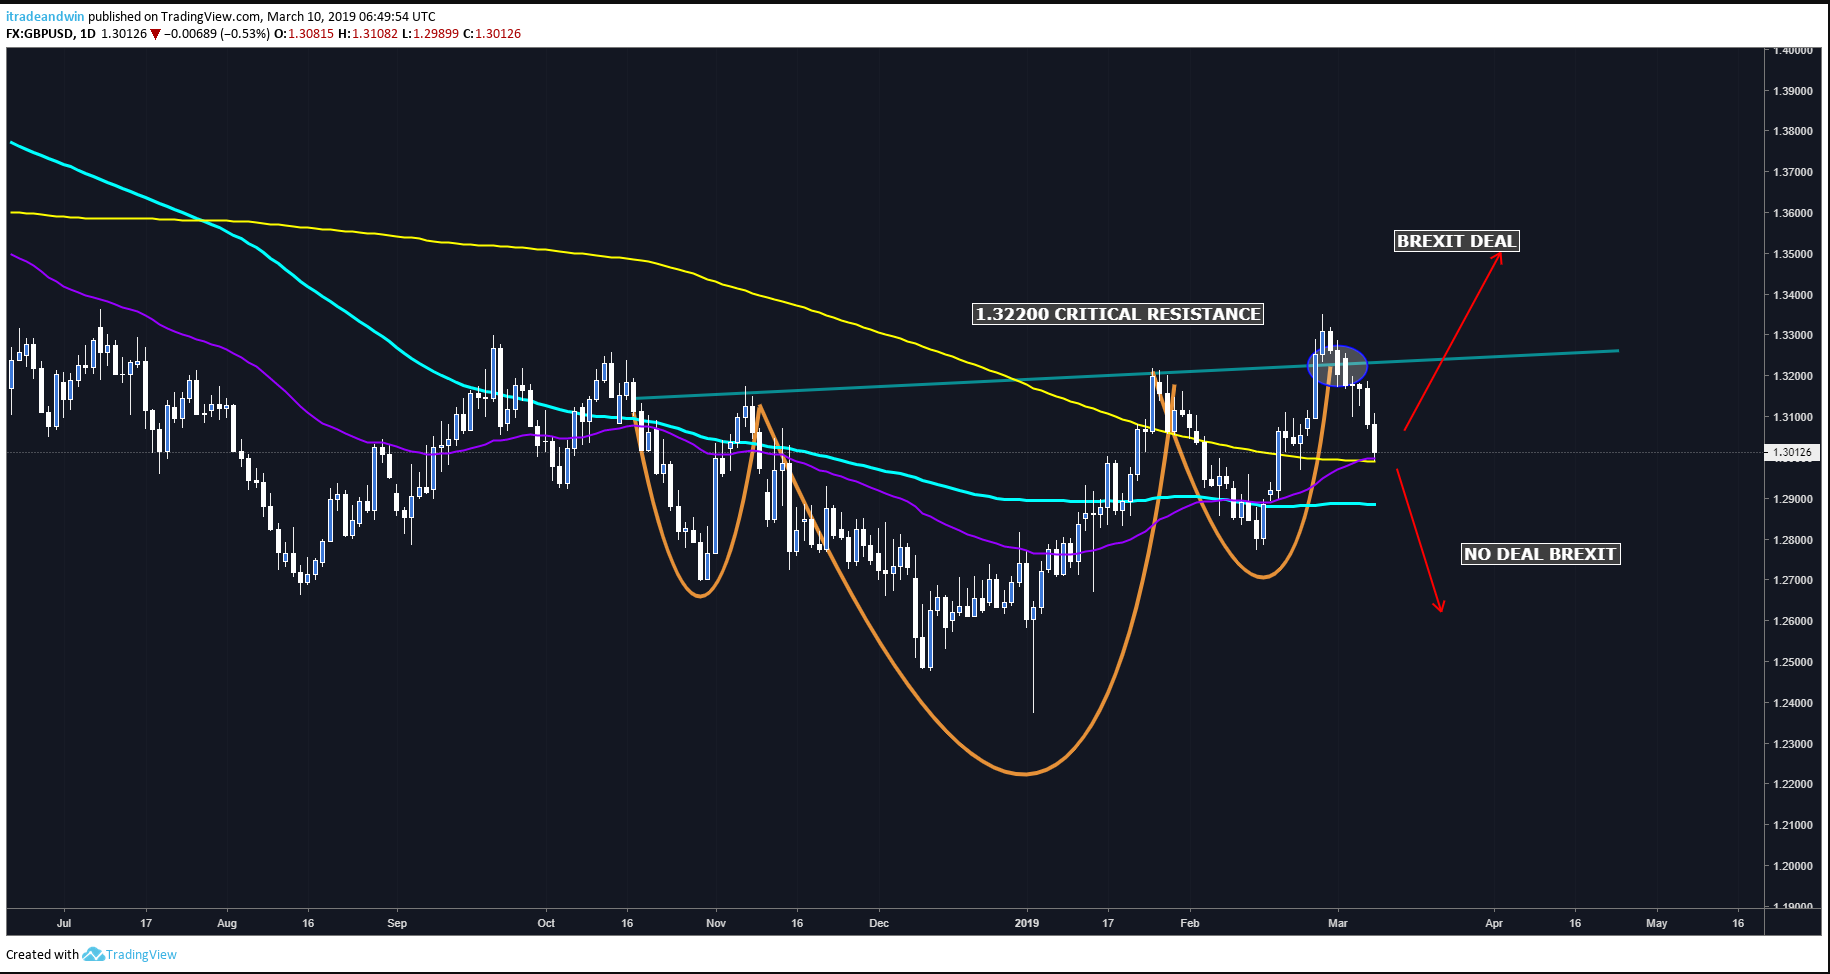
On the smaller charts, as we have published last week, an inverted head & shoulders pattern became validated.1.32200 is the resistance and the invalidation level of the pattern is 1.29800.
Cable broke 1.32200 and tested 1.33500 resistance. But this breakout attempt and the bullish move were not sustainable due to Brexit uncertainty. The pair pulled back towards 1.30100 support and ended the week at 1.30120.
“YES” to revised May-EU Plan: ( Probability 0.01% ) Our trade plan is to buy and add long at the closing above 1.32200 targets 1.34500 and 1.37000 with a stop loss below 1.30100.
Delayed Brexit: ( Probability 99.8 % ) Our trade plan is to buy and add Long at the closing above 1.32200 targeting 1.34500 and 1.37000 with a stop loss below 1.30100. Second Referendum Scenario: Targets 1.4000-1.45000
No-Deal Brexit: To sell GBPUSD targets 1.2700 and 1.23000. And if we take “BoE’s projection of 25% decline” into consideration, this sell of may continue towards 1.2000.
Gamblers: They may buy or sell. No worries, only the table wins.
Anhänge: