


Candlestick Patterns

What are Candlestick Patterns?
Candlestick patterns are a crucial aspect of technical analysis in the world of forex trading. Originating from Japan, these patterns have gained widespread popularity among traders due to their ability to provide valuable insights into market sentiment and price movements. Each candlestick on a chart represents a specific period, and the patterns formed by these candlesticks help traders predict potential price changes.
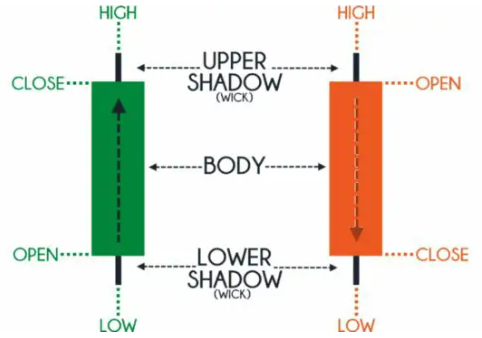
A candlestick pattern is a visual representation of price action in the form of candle-shaped elements on a chart. Each candlestick consists of a body and wicks (also known as shadows or tails).
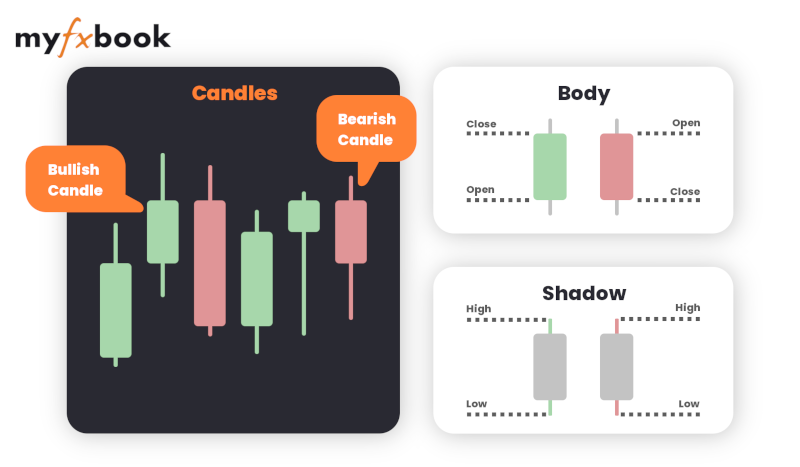
The body represents the opening and closing prices during a specific period, with the color indicating whether the closing price is higher (bullish) or lower (bearish) than the opening price. While the wicks represent, the highest and lowest prices reached within that period.
Candlestick patterns can be single or multiple candles and provide valuable information about market sentiment and potential reversals.
Why are Candlestick Charts Important?
Candlestick charts offer a visual representation of price action that can quickly convey information in an easily interpretable format.
They provide insights into price trends, market psychology, and potential turning points. By spotting recognizable patterns in these charts, traders can identify possible trend reversals, entry and exit points, and market trends with higher accuracy.
How to Read Candlestick Patterns?
Reading candlestick patterns involves analyzing and understanding the various components of each candle and their relationships with the candles that came before and after it.
Here are some key aspects to consider when reading candlestick patterns:
Identifying the Timeframe
The timeframe refers to the duration represented by each candlestick on the price chart. You can determine the timeframe represented by each candlestick, it can be minutes, hours, days, weeks, or months, depending on your analysis preference. It's essential to match the timeframe with your trading strategy and goals. Different patterns may have varying significance depending on the timeframe being analyzed.
Candlestick Colors
A bullish candle (often seen in green or white) indicates that the closing price is higher than the opening price, indicating buying pressure. Whereas a bearish candle (typically seen in red or black) indicates that the closing price is below the opening price, indicating selling pressure.
Candlestick Bodies
The length and shape of the candlestick body provide insights into price volatility and market sentiment. A long bullish (bearish) candle indicates strong buying (selling) pressure, while a small body suggests indecision or consolidation.
Candlestick Wicks
The highest and lowest prices that were encountered during the time period are shown by the wicks above and below the body. They reveal the price volatility and can indicate potential support and resistance levels.
The length of the wicks relative to the body can indicate the presence of price rejections or reversals. Longer upper wicks suggest selling pressure or resistance levels, while longer lower wicks indicate buying pressure or support levels.
Patterns and Formations
By observing the arrangement and sequence of candlesticks, you can identify specific patterns that provide signals for potential trend reversals or continuations. Examples of common patterns include Doji, Hammer, Engulfing, and Shooting Star.
What are Bullish, Bearish, and Reversal Candlesticks?
The terms "bullish" and "bearish" are derived from traditional market terminology; the terms draw parallels to the way that bulls and bears attack their opponents. A bull thrusts its horns upward, representing an upward price movement. On the other hand, a bear swipes its paws downward, representing a downward price movement.
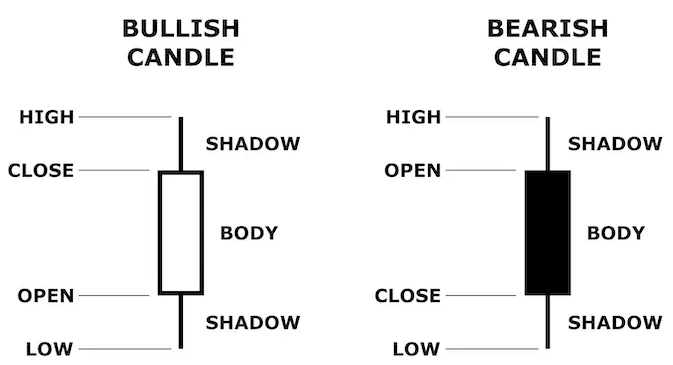
The Bullish Candlestick
In a bullish market, the candlesticks are represented in a green or white color, indicating that the closing price is higher than the opening price, signaling positive market sentiment and buyer dominance.
The Bearish Candlestick
In a bearish market, the candlesticks are represented in a red or black color, indicating that the closing price is lower than the opening price, signaling negative market sentiment and seller dominance.
The Reversal Candlestick
A reversal candlestick suggests a potential change in the current trend, those candlesticks can be bullish or bearish acting as early indicators of trend reversals.


