


Single Candlestick Patterns

What are Single Candlestick Patterns?
Single candlestick patterns, as the name suggests, are chart formations made up of just one candlestick. These patterns can provide traders with valuable information about market sentiment, potential reversals, and continuation of trends. Although they consist of only one candle, they still convey valuable information to traders.
Types of Single Candlestick Patterns
Doji Candlestick
The Doji candlestick pattern is a type of candlestick formation in forex trading that is used to indicate potential market reversals. A Doji is a single candle that is characterized by having little or no real body, with the upper and lower shadows indicating the trading range for that period. The lack of a real body, combined with equal or nearly equal shadows, suggests that market forces are in balance and that neither buyers nor sellers have gained control.
Is the Doji Candlestick Bullish or Bearish?
The Doji candlestick can be either bullish or bearish.
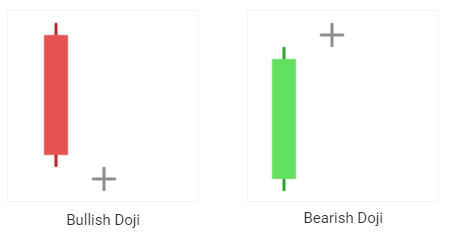
When the market opens, a neutral Doji candle appears, and bullish traders drive prices higher, while bearish traders push prices lower. However, it will encounter strong resistance or support at some point and will reverse direction, encountering the same level of counteraction. In the end, it ends at roughly the same level where it began, implying a period of indecision.
Shooting Star Candlestick
The Shooting Star is a single candlestick pattern formed when the price is increasing. To be considered a Shooting Star candle the difference between the highest price of the day and the starting price must be more than twice the size of the candle's body and there should be very little shadow or no shadow at all beneath the actual body.
In addition, traders must be careful not to mistake the Shooting Star candlestick for the Inverted Hammer candlestick, both have the same form but present traders with distinct indications. Both might be interpreted as potential trend-reversal indicators. The only difference between them is the place they take in the chart. A shooting star appears after a price gain and indicates a probable downward turning point, on the other hand, an inverted hammer appears after a price decrease and indicates a future upward trend.
Is the Shooting Star Candlestick Bullish or Bearish?
The Shooting Star pattern is a bearish candlestick, and it is estimated to be a stronger formation as the bears are allowed to refuse the bulls and can drive the prices even lower by ending below the initial price. When the initial price and the low are approximately the same, the Shooting Star pattern is regarded as less bearish, but still negative.
Long-Legged Doji Candlestick
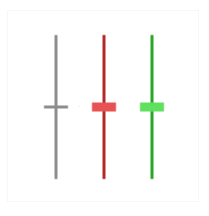
The Long-Legged Doji is a candlestick pattern, it is a reversal pattern that signals uncertainty and indecision in the market. The Long-Legged Doji is characterized by long upper and lower shadows and a small body. The length of the shadows indicates the level of volatility in the market and the small body shows that there was little price movement.
Is the Long-Legged Doji Candlestick Bullish or Bearish?
The Long-Legged Doji is a neutral pattern that can be either bullish or bearish depending on market conditions and the preceding trend. A Long-Legged Doji that forms after an uptrend may indicate a potential bearish reversal, while a Long-Legged Doji that forms after a downtrend may indicate a potential bullish reversal.
Inverted Hammer Candlestick
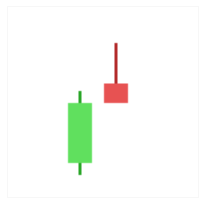
The Inverted Hammer Candlestick is a type of pattern used in technical analysis to signal a potential reversal in the current trend. The pattern consists of a single candle with a long upper shadow and a small real body near the low of the candle. The upper shadow should be twice as long as the actual body. The name "Inverted Hammer" is derived from the shape of the pattern, which resembles an inverted hammer.
Is the Inverted Hammer Candlestick Bullish or Bearish?
The bullish inverted hammer candlestick pattern is a bullish reversal signal that forms during a downtrend, characterized by a small body at the top of the candle, a long lower wick, and little to no upper wick, indicating that the bears initially pushed the price down but the bulls were able to push it back up, potentially signaling a shift in market sentiment from bearish to bullish. Traders may use this pattern as a signal to buy the asset, but it's important to confirm any signals with additional analysis before making trading decisions.
Doji Star Candlestick
The Doji Star Candlestick pattern is a type of reversal pattern that is formed by two candles, one of which is a Doji and the other is a standard candle. The Doji represents market indecision, while the standard candle represents the prevailing trend. The formation of a Doji star candlestick is seen as a signal of a potential trend reversal.
Is the Doji Star Candlestick Bullish or Bearish?
The direction of the trend reversal indicated by a Doji Star candlestick can be either bullish or bearish.
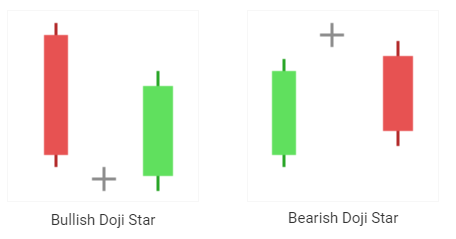
If a Doji Star forms after a downtrend, it is considered a bullish reversal pattern, signaling a potential price reversal to the upside. This is referred to as a "Bullish Doji Star."
Conversely, if a Doji Star forms after an uptrend, it is considered a bearish reversal pattern, signaling a potential price reversal to the downside. This is referred to as a "Bearish Doji Star."
Evening Star Doji Candlestick
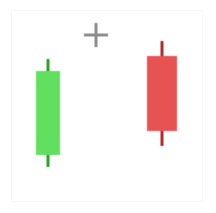
The Evening Star Doji is a three-candlestick pattern, it is formed when a long bullish candlestick is followed by a Doji candlestick that gaps away from the previous candle and then a third bearish candle that confirms the reversal. The Doji in this pattern signals indecision among market participants and the gap between the Doji and the previous candle indicates that the bears have taken control.
Is the Evening Star Doji Candlestick Bullish or Bearish?
The Evening Star Doji is a bearish reversal pattern, signaling a potential reversal from an uptrend to a downtrend. It is called an "Evening Star" because the Doji signals the end of a bullish trend and the start of a bearish trend, similar to the setting of the sun.
Spinning Top Candlestick
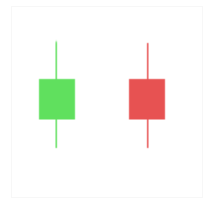
A spinning top pattern occurs when a candlestick's real body is small, and its upper and lower wicks are long, forming a small square. The spinning top pattern indicates indecision between buyers and sellers, as the price opened and closed near the same level, but there was significant volatility during the session. This pattern is often seen as a sign of a potential trend reversal.
Is the Spinning Top Candlestick Bullish or Bearish?
 The spinning top pattern can be either bullish or bearish.
A bullish Spinning Top candlestick forms when the close price is higher than the open price, it happens after a downtrend when buyers step in and prevent the price from falling further.
On the other hand, a bearish Spinning Top candlestick, forms when the open price is higher than the close price, it happens after an uptrend when sellers enter the market and prevent the price from continuing to rise.
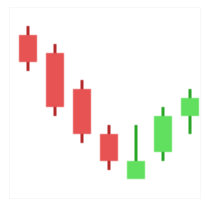
Morning Star Doji Candlestick
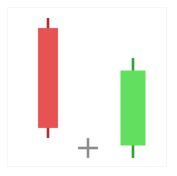
The Morning Star Doji is a candlestick pattern that is characterized by a small real body with an upward or downward gap. This gap is then followed by a Doji, which is a neutral candle, and finally another real body in the opposite direction of the gap.
Is the Morning Star Doji Candlestick Bullish or Bearish?
The Morning Star Doji is a bullish reversal pattern, implying a potential uptrend in price. The small real body in the first candle signifies a pause in the prevailing trend, and the gap between the first and second candles shows a shift in market sentiment. The appearance of a Doji, which is a neutral candle, implies market indecision. Finally, the real body in the third candle confirms the shift in market sentiment, indicating a potential uptrend.
Marubozu Candlestick
The Marubozu candlestick pattern, its candle has a long body with no shadow or a very small shadow, indicating that either the opening or closing price is equal to the high or low for the period. This means that there was very little price movement throughout the period and the bulls or bears had control of the market.
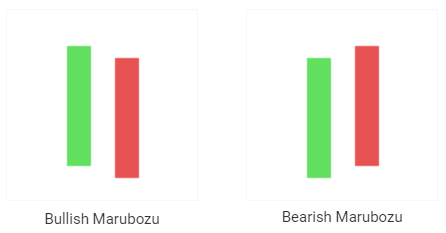
Is the Marubozu Candlestick Bullish or Bearish?
The Marubozu candlestick is considered bullish or bearish based on the direction of the long body of the candle. If the body of the candle is above the opening price, it is considered a bullish Marubozu, indicating that the price rose during the period and the bulls were in control. Conversely, if the body of the candle is below the opening price, it is considered a bearish Marubozu, indicating that the price fell during the period and the bears were in control.


