


Dual Candlestick Patterns

What are the Dual Candlestick Patterns?
The Dual Candlestick Patterns are based on the patterns created by two consecutive candlesticks. These formations provide traders with valuable information about market sentiment and potential trading opportunities.
Types of Single Candlestick Patterns
Piercing Candlestick
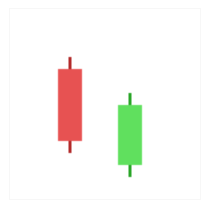
The Piercing Candlestick pattern is a bullish reversal pattern that is used in technical analysis to identify potential changes in the trend. It is formed when the current period's candlestick closes higher than the midpoint of the previous period's candlestick, which must be bearish. This pattern signals a shift in market sentiment, suggesting that an upward trend may be emerging.
Is the Piercing Candlestick Bullish or Bearish?
The Piercing Candlestick is a bullish reversal pattern. It is formed when the real body of the current candle is bullish and closes above the midpoint of the preceding bearish candle. This pattern signals a potential reversal in the trend and could indicate that the market is about to move in the opposite direction.
Engulfing Candlestick
The Engulfing Candlestick pattern is a two-candlestick pattern that is used in technical analysis to identify potential changes in the market trend. It is a visual representation of the market's sentiment, indicating a potential reversal in the price direction. The Engulfing Candlestick is formed when the real body of the current candle completely engulfs the real body of the preceding candle.
Is the Engulfing Candlestick Bullish or Bearish?
The Engulfing Candlestick can be either bullish or bearish.
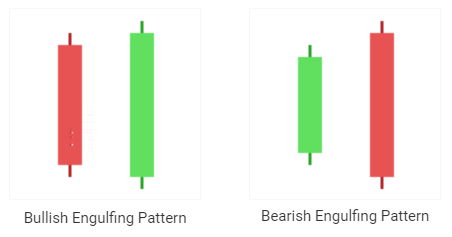
The bullish engulfing pattern occurs during a downtrend and is formed by two candlesticks. The first candlestick is a small bearish candlestick, while the second candlestick is a long bullish candlestick that completely engulfs the previous day's candlestick, including its body and shadows. This pattern indicates that the market sentiment has shifted from bearish to bullish, with the bulls taking control of the market.
The bearish engulfing pattern occurs during an uptrend and is formed by two candlesticks. The first candlestick is a small bullish candlestick, while the second candlestick is a long bearish candlestick that completely engulfs the previous day's candlestick, including its body and shadows. This pattern indicates that the market sentiment has shifted from bullish to bearish, with the bears taking control of the market.
Dark Cloud Cover Candlestick
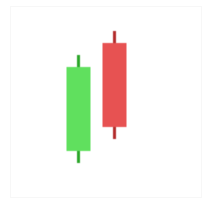
The Dark Cloud Cover candlestick pattern is a bearish reversal pattern that is formed by two candlesticks, a long bullish candlestick followed by a long bearish candlestick. The bullish candlestick opens below the previous day's close and closes near its high, indicating that buyers were in control and pushed prices up. However, the bearish candlestick that follows opens above the previous day's high, indicating that buyers are still active and optimistic. But, the bearish candlestick then closes below the midpoint of the bullish candlestick, forming a "cloud" that covers the previous day's gains.
Is the Dark Cloud Cover Candlestick Bullish or Bearish?
The Dark Cloud Cover candlestick pattern is considered bearish, the pattern suggests that the sellers have gained control and may be willing to push prices lower. It also indicates that there may be an increase in selling pressure as the bullish momentum is slowing down. Traders who see this pattern may take it as a sign to sell or take profits on long positions, or to enter short positions.
Harami Candlestick
The Harami candlestick pattern is a two-candle reversal pattern that is commonly used by forex traders to identify potential trend reversals in the market. The pattern is formed when the first candle is long and is followed by a second candle that is shorter and completely contained within the first candle's body. The name "Harami" means "pregnant" in Japanese, reflecting the appearance of the second candle being "pregnant" within the first.
Is the Harami Candlestick Bullish or Bearish?
The Harami candlestick can be either bullish or bearish.
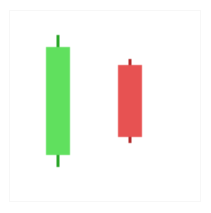
A bullish Harami pattern is formed when the first candle is a long bearish candle, followed by a smaller bullish candle that is contained within the bearish candle's body. This pattern suggests that selling momentum is waning and that a bullish reversal may be approaching.
On the other hand, a bearish Harami pattern is formed when the first candle is a long bullish candle, followed by a smaller bearish candle that is contained within the bullish candle's body. This pattern suggests that buying momentum is waning and that a bearish reversal may be approaching.
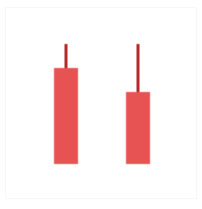
Matching Low Candlestick
The Matching Low is a candlestick pattern is a two-candle pattern that is characterized by two candlesticks that have the same closing price, indicating that the bears and bulls are in a state of equilibrium. The first candlestick in the pattern is a long black candlestick, which shows that the bears are in control of the market. The second candlestick is a long white candlestick, which opens at or below the previous day's low and closes at or near the previous day's closing price.
Is the Matching Low Candlestick Bullish or Bearish?
The Matching Low candlestick pattern is generally considered to be a bullish reversal pattern. It indicates that the bears have lost their momentum, and the bulls are starting to take control of the market. The fact that the second candlestick closes near the previous day's closing price shows that there is support for the price at that level. This means that there are buyers willing to step in and buy at that price, which can help to push the price higher.


