Advertisement
gold advise

Oct 11, 2013からメンバー
769 投稿
Oct 25, 2018 at 03:11
Gold tries to go back up and it may visit the 200 day EMA at the 1248 level from where it may bounce to the downside. In case of going back down, the 55 day EMA at the 1214 level may act as support.

Jul 10, 2014からメンバー
1114 投稿
Oct 26, 2018 at 13:29
It's quite bullish for now and it will likely reach $1,248. It may even break out above that level and continue rising towards $1,270.

Sep 12, 2015からメンバー
1933 投稿
Oct 26, 2018 at 15:26
victoriajensen posted:
It's quite bullish for now and it will likely reach $1,248. It may even break out above that level and continue rising towards $1,270.
Flight to safety.
"They mistook leverage with genius".
Jul 10, 2014からメンバー
1114 投稿
Oct 27, 2018 at 15:38
There was no breakout, but next week there will likely be a new move to the upside.
Jul 10, 2014からメンバー
1114 投稿
Oct 30, 2018 at 19:29
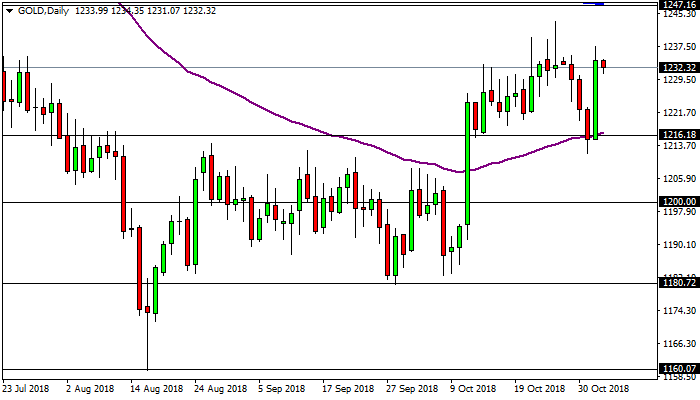
Gold found some resistance at $1,245 and bounced off from it after forming a shooting star candlestick on the daily time-frame at that level, it may next fall back towards $1,215 as a part of the sideways consolidation.
Jul 10, 2014からメンバー
1114 投稿
Oct 31, 2018 at 18:52
Gold did reach $1,215 and is currently testing that level, a breakout below it may lead to a further move to the downside towards $1,200.
Oct 11, 2013からメンバー
769 投稿
Oct 31, 2018 at 23:57
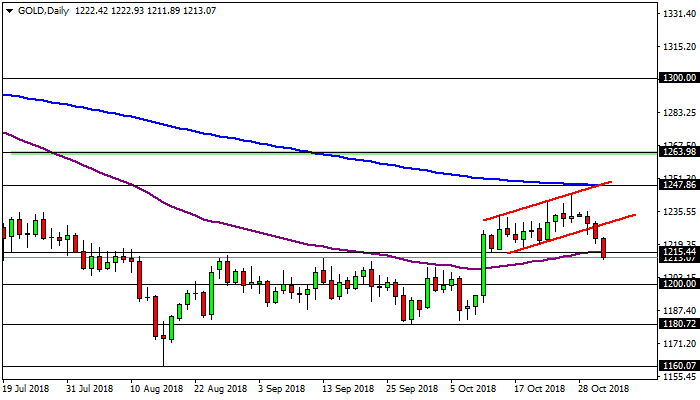
The price of gold confirms its breakout below the lower trendline of a bullish channel, identified a few weeks ago on the daily chart. Gold also breaks below the 55 day EMA around the 1215 level and it could keep falling towards the 1200 level, which could act as support. The price of gold is pressured by the rally on the US Dollar and by the trade war between the US and China. Below the 1200 level, the next support levels are at the 1180 and the low at the 1160. To the upside, the channel is invalidated and the price may say consolidated between the 55 and 200 day EMA.
付属品:
Jul 10, 2014からメンバー
1114 投稿
Nov 01, 2018 at 18:55
Gold bounced off from $1,215 and it will likely rise back towards $1,240.
Oct 11, 2013からメンバー
769 投稿
Nov 02, 2018 at 04:15
(編集済みのNov 02, 2018 at 04:16)
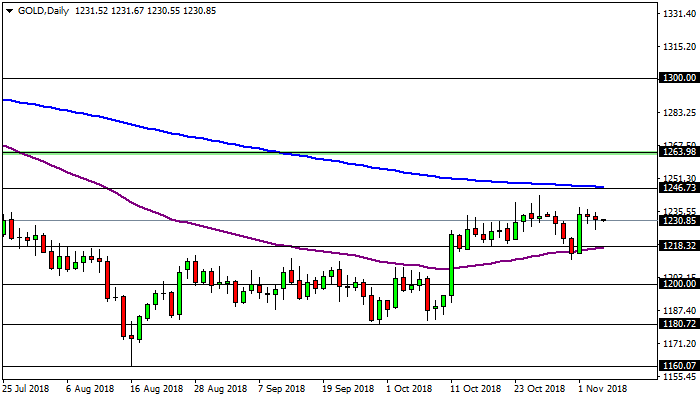
The price of gold bounces to the upside from the 55 day EMA at the 1216 level and reaches the 1232 level. If it continues rallying, the 200 day EMA at the 1247 level could act as resistance. Below the 55 day EMA, the 1200 could act as support.
付属品:
Jul 10, 2014からメンバー
1114 投稿
Nov 02, 2018 at 18:05
It found some resistance at $1,236 and bounced off from it, there will likely be another sideways consolidation.
Oct 11, 2013からメンバー
769 投稿
Nov 06, 2018 at 00:23
The price of gold is stuck right in between the 55 day EMA at the 1218 level and the 200 day EMA at the 1246 level. From the current level at the 1230, the price of gold could head in any direction. Both moving averages could act as resistance and support, but a breakout above the 200 day EMA could take the price to the 1263 level where we can find the 200 week EMA. Below the 55 day EMA, its next support could be the 1200 level.
付属品:
Jul 10, 2014からメンバー
1114 投稿
Nov 07, 2018 at 16:29
Even the fundamentals yesterday couldn't end the sideways consolidation. Next target is likely at $1,235.
Jul 10, 2014からメンバー
1114 投稿
Nov 08, 2018 at 18:01
Gold has formed a shooting star candlestick and a hanging man candlestick below the resistance at $1,245 on the weekly time-frame, there will likely be a new move to the downside.
Oct 11, 2013からメンバー
769 投稿
Nov 09, 2018 at 04:05
Gold drops again to the 55 day EMA around the 1218 level, where it may find some support, but a breakdown of that moving average could trigger a drop to the 1200 area. To the upside, the 200 day EMA around the 1246 could act as resistance.
Jul 10, 2014からメンバー
1114 投稿
Nov 09, 2018 at 17:36
It did bounce off from $1,245 and it will likely fall back towards $1,200, the question is whether it will break out below that level too.
Jul 10, 2014からメンバー
1114 投稿
Nov 12, 2018 at 18:04
Gold is testing the support at $1,200 and a breakout below that level will likely lead to a further move to the downside towards $1,185.
Jul 10, 2014からメンバー
1114 投稿
Nov 13, 2018 at 17:34
Gold is still consolidating around $1,200 and whether there will be a breakout below that level depends on the fundamentals until the end of the week.
Oct 11, 2013からメンバー
769 投稿
Nov 14, 2018 at 03:01
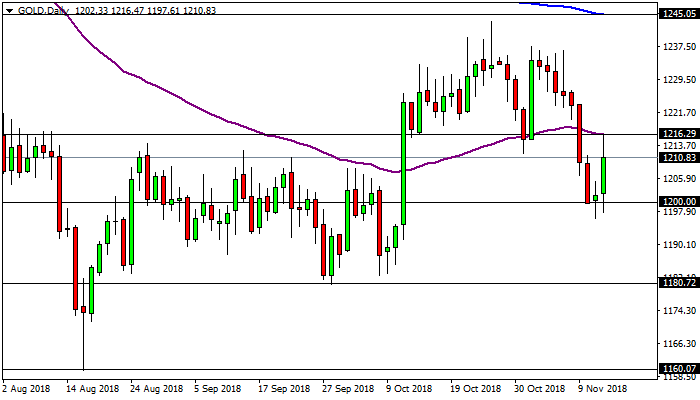
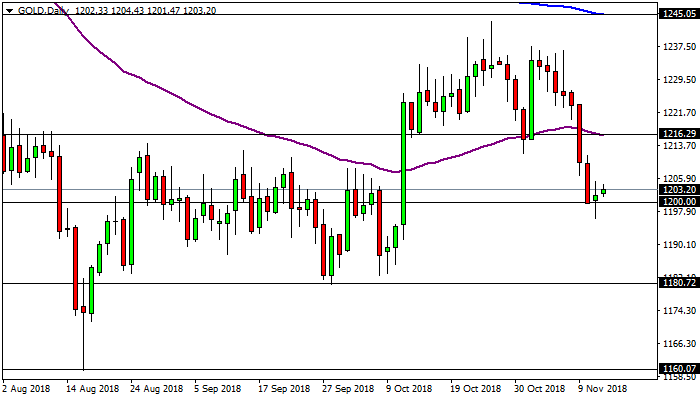
Gold drops to the 1200 level as shown on the daily chart, where it may find a support. To the upside, the 55 day EMA could act as resistance at the 1216 level. Below the 1200 level, its next support could be the 1180 level, followed by the 1160 level.
付属品:
Jul 10, 2014からメンバー
1114 投稿
Nov 14, 2018 at 16:45
Gold did find some support at $1,200 and it may bounce off from it. If it does, next target will likely be at $1,215.