


Advertisement
gold advise

Oct 11, 2013からメンバー
769 投稿
Jan 04, 2019 at 00:48
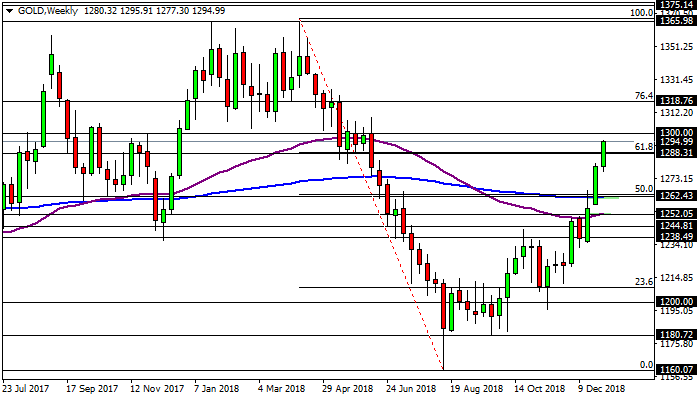
The bullish correction on gold continues and its price manages to break above the 61.8% Fibonacci retracement that we can see on the weekly chart, around the 1288 level. The price of gold has been retracing from the 1160 low but now the 1300 level could act as resistance. In case of continuing higher, the 76.4% Fibo at the 1318 level could act as resistance. The long term resistance is located at the 1365 peaks. On the other hand, if the price comes back down, then the 200 week EMA along with the 50% Fibo at the 1262 level could act as support.
付属品:
Oct 11, 2013からメンバー
769 投稿
Jan 14, 2019 at 22:42
Gold has formed what it appears to be a bullish flag around the 61.8% Fibo on the daily chart at the 1288 level. The 1300 level may act as resistance, while the 1262 zone may act as support.
Feb 27, 2019 at 10:14
If you want to earn very rapidly from this trading place first of all you have to acquire most powerful analyzing trade knowledge by learning. so, it would be great if we choose the broker which always ensures exclusive educational facilities.


*商用利用やスパムは容認されていないので、アカウントが停止される可能性があります。
ヒント:画像/YouTubeのURLを投稿すると自動的に埋め込まれます!
ヒント:この討論に参加しているユーザー名をオートコンプリートするには、@記号を入力します。


