


Reklāma
Is outlook data relevant?
Nov 20, 2016 at 07:57
826 Views
2 Replies
Biedrs kopš
5 ieraksti
Nov 20, 2016 at 07:57
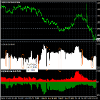
I have marked strange spikes at open interest indicator on the image attached
Strange thing is that positions volume decreases sharply and then recovers fast and this change is sometimes relatively very big
The first indicator is open interest, the second one is volumes.
The data is from community outlook and seems that the numbers are correct and match with those on the site
Could anybody explain this strange thing?
Pielikumi
Biedrs kopš
5 ieraksti
Nov 22, 2016 at 11:18
So nobody uses this data for serious things?

*Spams netiks pieļauts, un tā rezultātā var slēgt kontu.
Tip: Posting an image/youtube url will automatically embed it in your post!
Tip: Type the @ sign to auto complete a username participating in this discussion.


