


Advertisement
Is outlook data relevant?
Nov 20, 2016 at 07:57
825 การดู
2 Replies
Nov 20, 2016 at 07:57
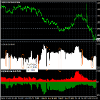
I have marked strange spikes at open interest indicator on the image attached
Strange thing is that positions volume decreases sharply and then recovers fast and this change is sometimes relatively very big
The first indicator is open interest, the second one is volumes.
The data is from community outlook and seems that the numbers are correct and match with those on the site
Could anybody explain this strange thing?
ไฟล์แนบ :

*การใช้งานเชิงพาณิชย์และสแปมจะไม่ได้รับการยอมรับ และอาจส่งผลให้บัญชีถูกยกเลิก
เคล็ดลับ: การโพสต์รูปภาพ/youtube url จะฝังลงในโพสต์ของคุณโดยอัตโนมัติ!
เคล็ดลับ: พิมพ์เครื่องหมาย @ เพื่อป้อนชื่อผู้ใช้ที่เข้าร่วมการสนทนานี้โดยอัตโนมัติ


